Download
1 / 21
210 likes | 359 Views
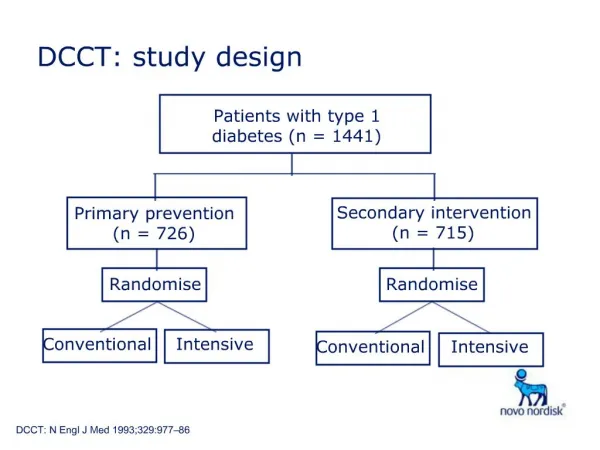
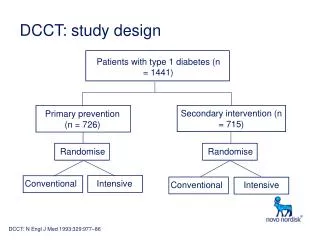
Temperature Simulation DCCT at PETRA III. D. Lipka, MDI, DESY Hamburg. Two cases of operation with different temperatures at the current monitor observed Case 1: I1=85 mA, N=160 Bunches gives about 70°C Case 2: I2=65 mA, N=40 Bunches gives about 130°C Questions:

E N D
Temperature Simulation DCCT at PETRA III D. Lipka, MDI, DESY Hamburg
Two cases of operation with different temperatures at the current monitor observed Case 1: I1=85 mA, N=160 Bunches gives about 70°C Case 2: I2=65 mA, N=40 Bunches gives about 130°C Questions: Why case 2 higher temperature? Why temperature high? Problem
Power P = I Q kloss I is mean beam current Q is charge = I Dt Dt is bunch distance = t / N t is PETRA III revolution time = 7.685 µs kloss is voltage loss per charge for a structure Result in P = I2 t kloss / N P1/P2 = 0.43 Because P2 is higher the temperature is higher! Compare: PE-XFEL,max/P2=0.0001 Answer Problem 1
Setup DCCT PEEK AlMg3 µ-metal Stainless Steel CuBe Iron ceramic In CST imported model from Annette Brenger
Inner Setup Bellow shielded, but results in a resonator Ceramic coated with Molybdenum. When a charged particle moves through DCCT, it looses energy due to gap=8.2 mm!
Wakefield simulation with beam: get energy loss Eigenmode of setup: get field distribution of loss Thermal: input power and field distribution, get temperature distribution Simulation
Wakefield Simulation Mesh cells around bellow and ceramic: Simulation tool can not resolve bellow and coating perfect! Anyhow: kloss=39.1 V/nC ->P1=13.6 W, P2=31.7 W
Eigenmode Simulation Field distribution Setup: only vacuum part Field distribution between bellow and shielding
Temperature Distribution P2 Included: heat conductivity of all materials and heat radiation No special cooling available, next is 4.2 m away. Therefore cooling applied at the end of both beam pipes at 2.1 m No cooling in x and y Here maximum temperature of 107 °C
Temperature distribution shortened P2 Here the distance to cooling is only 200 mm, Tmax=106°C, because heat radiation along pipe acts like a cooling, therefore this shortened model can be used Measured 130°C; Simulation underestimates temperature by 18%, reason: mesh, perhaps higher loss factor in reality
Temperature distribution P2 with airflow Here the simulation box increased with cooling at xmin,max and ymin,max, Tmax reduces from 106°C to 87.5 °C
Temperature distribution P1 Airflow switched off. Lower Temperature because of lower power Measured 70°C, simulation lower by 16%
Setup: smaller gap Smaller gap = 1.7 mm should reduce energy loss Gap near chamfer to result in good energy transmission Kloss = 15.1 V/nC
Eigenmode distribution Field amplitude near gap
Temperature distribution P2 Maximum temperature reduced from 106 °C to 55°C (remember: simulation underestimates temperature)
Setup without coating gap = 1.7 mm symmetrically below ceramic Ceramic without coating to result in higher energy transmission Kloss = 26.6 V/nC, because gap is deeper without coating
Eigenmode distribution Field has poor accuracy, because space between bellow and iron included; highest amplitude near left gap
Temperature distribution P2 Maximum temperature reduced from 106 °C to 85°C (remember: simulation underestimates temperature)
Setup: with coating and add shielding gap = 8.2 mm like origin, coating actives Shielding of resonator Kloss reduced to 4.4 V/nC, because influence of resonator avoided No resonance found below cutoff (2.44 GHz)
Temperature distribution P2 Maximum temperature reduced from 106 °C to 31°C (remember: simulation underestimates temperature)
Summary • Simulated temperature distribution • Temperature underestimated, but trend is in agreement • Smaller gap and shielding of resonator reduces temperature • Suggestion: smaller gap and/or close space between bellow and shielding origin