Download
1 / 16
630 likes | 3.01k Views
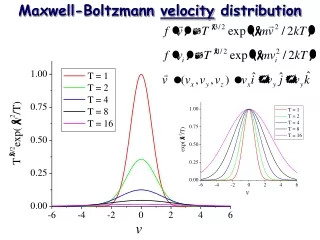
Maxwell-Boltzmann Distribution Curves. Mrs. Kay Chem 12 A. In a sample gas or liquid, the molecules are in constant motion and collision. When they do this, no energy is lost from the system - they’re elastic collisions. Each molecule varies in its own energy, some have more, some less. .

E N D
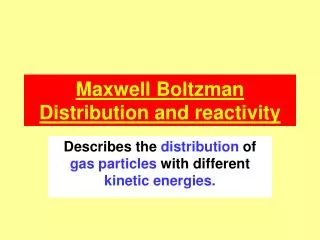
Maxwell-Boltzmann Distribution Curves Mrs. Kay Chem 12 A
In a sample gas or liquid, the molecules are in constant motion and collision. • When they do this, no energy is lost from the system - they’re elastic collisions. • Each molecule varies in its own energy, some have more, some less.
A Maxwell-Boltzmann distribution curve/graph shows how the energy was spread out over different molecules
Remember… • the area under the curve = the total molecules in the sample, and it doesn’t change • All molecules have energy • Few molecules have high energies, but there is no maximum energy for a molecule.
If you increase the temperature of the sample, the distribution becomes stretched out and has a lower peak, but the area under the curve remains the same.
To speed up the reaction, you need to increase the number of the very energetic particles - those with energies equal to or greater than the activation energy. Increasing the temperature has exactly that effect - it changes the shape of the graph. / Energy
Molecularity • The number of molecules that participate as reactants in an elementary step • Unimolecular: a single molecule is involved. • Ex: CH3NC (can be rearranged) • Bimolecular: Involves the collision of two molecules • NO + O3 NO2 + O2 • Termolecular: simultaneous collision of three molecules. Far less probable.
Rate Law • Math expression to show how rate depends on concentration Rate = k[reactant 1]m[reactant 2]n… • m and n are called reaction orders. Their sum is called the overall reaction order. • k is the rate constant. It is specific to a reaction at a certain temperature. • The value of the exponents are determined experimentally, we cannot use stoichiometry!
Sample Exercise 1: 2NO + 2H2 N2 + 2H2O is the reaction we’re studying, this is the data found during our experimentation
Study the data Exp #1 and #2, [NO] is unchanged, [H2] is doubled and this causes the rate to double (0.0678/0.0339 =2), the H2’s rate order is 1. Exp #1 and #3, [H2] is unchanged, [NO] is doubled and this causes the rate to quadruple (0.1356/0.0339 =4), NO’s rate order is 2. Rate = k [NO]2[H2] The overall rate order for this reaction is 3 (1+2)
Suppose… If when we ran exp #1 and #3 , the rate didn’t change, what rate law would we expect? • Since it didn’t change when we doubled [NO], the rate order is 0, meaning the rate doesn’t depend on the concentration of NO at all, so rate= k[H2] and the overall reaction order is 1.
Sample Exercise 2: • Use the kinetics data to write the rate law for the reaction. What overall reaction order is this? 2NO + O22NO2
Sample Exercise 3 Rate data for the reaction: CH3Br + OH- CH3OH + Br- Use the data to find the experimental rate law.