ASENT Reliability Manager: Predictions & Reporting
340 likes | 443 Views
Learn how to utilize the ASENT Reliability Manager tool for reliability predictions, data import, failure rate calculation, and report generation. Efficiently manage product tree structures and ensure system reliability.

ASENT Reliability Manager: Predictions & Reporting
E N D
Presentation Transcript
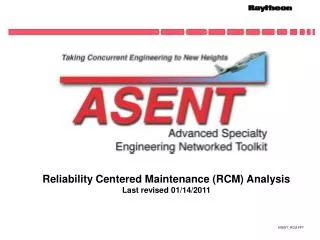
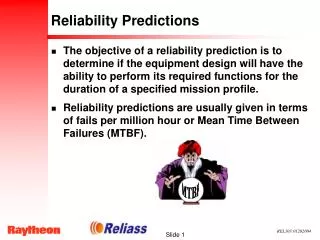
Reliability Predictions Last revised 02/10/2011
Introduction The Reliability Manager is the tool in ASENT that is used to perform a Reliability Prediction. Here, the user can define the product tree structure and specify part lists, either by adding them one at a time, in groups, or importing them from BOM or CAD files. The product tree structure can be easily built in the Reliability Manager. Tree nodes can be added, copied, moved or deleted. Entire trees or sub-trees can be imported either from other ASENT projects or from Excel files. COTS items can be imported from the Assembly Data Manager. Both Operating and Non-Operating predictions can be performed.
Invoking the Reliability Manager To invoke the Reliability Manager merely right-click on a project and select the Reliability Manager menu option.
Reliability Mgr. Displays product tree This screen displays the product tree structure for the DEMO_PRJ project. Click on the ‘+’ symbol to expand a branch in the tree, and click on the ‘-’ symbol to collapse a branch in the tree. When you right-click on a item in the product tree, then a drop-down menu will appear.
Reliability Mgr. Online Help Book To pull up the online help, select the Help menu option and select Contents and Index. This will display the help books for the active tool. This screen shows the user pulling up the help books for the Reliability Manager.
Reliability Mgr. Online Help Book For detailed explanations on menu options, data tabs and other information associated with the product tree, select the Working with the Product Tree topic.
Importing data from other projects The Import Subtree option makes importing data from other ASENT projects, the Assembly Library, or from Excel Product Tree templates very easy. In the slides that follow we will import a MODEM card from the Computer project to the Chassis of DEMO_PRJ. For information on importing data from an Excel product tree template refer to the following tutorial: ASENT Import Templates
Product tree for the computer project Here, the user is presented with the product tree structure of the Computer project. The user selects the MODEM card and clicks on the OK button in order to import the MODEM card from the Computer project to the chassis of DEMO_PRJ.
Modem is imported to the chassis After the import, the MODEM card now appears in the chassis of DEMO_PRJ.
Calculate failure rates for entire system Failure rates can be calculated at any level (part, board, assembly, or the entire system). The following failure rate prediction methods are included: 217F, 217F-1, 217F-2, 217G Draft 4, Bellcore TR-332 Issue 6, Telcordia Issue 1 and 2, and the RAC Commercial Practices NonOp FR method. Mechanical part failure rates can be calculated using NSWC-07.
Calculate failure rates for entire system At the system level, the user specifies the prediction method, environment, and operating temperature to be used in performing the failure rate prediction. Caution: These values should NOT be entered for lower level assemblies or boards unless they are different than the system values. By default, lower level assemblies and boards will inherit the FR Method, Environment and Temperature of their parent.
Calculating failure rates Select the type of failure rates to calculate (Operating or Non-Operating) and click on the Calculate button. ASENT will then use the FR Method that you have chosen (i.e. If 217FN2 was selected for Operating failure rates, then ASENT will use MIL-HDBK-217F, Notice 2).
Status flags alert user of a problem Status Flags
Failure Rate calculation status flags The table below describes the meaning of the status flags that appear in the product tree after calculating failure rates.
Run troubleshooting on C0001 Below, the troubleshooting option is turned on and the failure rate for C0001 is re-calculated.
Run troubleshooting on C0001 After the calculation is complete, then ‘Finished’ will be displayed below the status bar, and the ‘View’ option at the top of the window is now selectable. Select the View | Diagnostic option to display the troubleshooting report.
Troubleshooting shows voltage overstress Here, the troubleshooting report shows that we have a voltage overstress condition.
Correct applied voltage for C0001 Enter a new applied voltage value for C0001. Notice that the user can enter either a value for the applied voltage, or a percent of the rated voltage for the part. Here, the user sets the applied voltage to 50% of the rated voltage for the part.
Report Generation Reports can be generated from any level in the product tree structure. Right-click on an item and select the Reports option. The Op Tree FR report is a very common reliability prediction report. It generates an indentured tree structure for the operating failure rate of the item. The report can be sorted by either failure rate or reference designator. It can include both assemblies and parts or just assemblies only.
Generating Prediction Reports Below is a standard failure rate prediction report. From the report viewer, reports are printed by clicking on the printer icon . Reports can be saved in a wide variety of formats by clicking on the icon.
Generating Derating Reports • Built-in DeratingTemplates • Easily Tailorable • Detailed, Color-coded Reports
Failure Rate Sensitivity Analysis ASENT’s survey tool allows you to calculate failure rates over a range of temperatures to see how sensitive you design is to increases in temperature. From the Failure Rate Calculator window, it is invoked by selecting the Temperature Scan option from the Analyze menu. Here, the user has selected a starting temperature of 55 degrees C with 5 degree increments. ASENT will calculate the failure rates based on 55, 60, 65, and 70 degrees.
Failure Rate Sensitivity Analysis The results of the temperature scan can be seen by selecting the Survey option from the View menu. The troubleshooting diagnostics associated with each run can be viewed by selecting the Diagnostic option from the View menu.
Exporting Survey Results to Excel These survey results can be easily exported to Excel by selecting the Export To Excel option from the File menu.
Failure Rate Sensitivity Analysis Use the View option to output bar and line charts.
Mission Profiler The Mission Profiler allows you to define profiles that depict various operating conditions that your product might be exposed to. From the Failure Rate Calculator, the Mission Profiler is invoked by selecting the Mission Profiler option from the Analyze men. From the Mission Profiler screen you can either select an existing profile or create new ones.
Mission Profiler Click on the icon below to create a new profile. New entries are made by clicking on the button. Profile results
Mission Profiler Results Below is the Excel file showing the Mission Profile results. These results are easily exported to Excel by selecting the Export To Excel option from the File menu.
Mission Profiler Results Results can also be displayed as bar or line charts by selecting the View option.