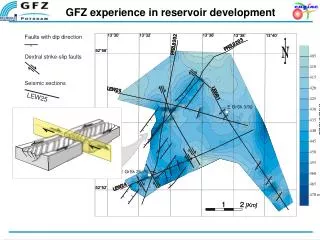
Reservoir Development Tools
Chapter 2 (Part 3). Reservoir Development Tools. Reservoir Development Tools. When information indicates a strong possibility of hydrocarbons oil companies will typically drill an exploratory well. While drilling geologist monitor the well through core samples, well logs, and test results.

Reservoir Development Tools
E N D
Presentation Transcript
Chapter 2 (Part 3) Reservoir Development Tools
Reservoir Development Tools • When information indicates a strong possibility of hydrocarbons oil companies will typically drill an exploratory well. • While drilling geologist monitor the well through core samples, well logs, and test results. • Geologist combine all the information and try to predict the production possibility of the formation.
Well Logs • Log: Record of information about the formations the well has been drilled through. • Typically two types: • Drillers Logs • Wire line Logs • Electric Logs • Radioactivity Logs • Acoustic Logs
Driller’s Log • Record of the kinds of rocks and fluids encountered at different depths and anything else of interest. • Mainly when formations are alternating from soft to hard rock – How long it took to drill through a particular formation. • Good drillers can correlate the time/data with other wells in the area and different formations.
Wire Line Logs • Wire Line: A metal line that can be run down the hole with a tool attached. • Conductor Line: Wire line that can carry electricity to the tool. (Both are commonly called “Wireline”) • Wire Line involves complex calculations and interpretation of the information the tool relays to the surface. • Logging Specialist use the data to compare, correlate and track the depth of formations. • Sonde: Instrument lowered down hole that relays all the information back to the surface.
Electric Logs • Spontaneous Potential (SP) Log • Records weak electrical currents that flow naturally in the rock next to the wellbore (Natural Electricity) • Shows the boundaries and thickness of each layer of rock • Easiest and most basic log – therefore the most common • Induced Electricity Log • Electrical signal is emitted by the sonde through the formation and relays it back to the receiver at the surface. • Receiver measures the formations resistance to current or how well it conducts current. • Resistivity Log: Records resistance • Induction Log: Records conductivity
Nuclear Logs • Radioactivity Logs • Measure natural and induced radioactivity in formations • Gamma Ray Log: • Records gamma particles (Gama Rays) that the formation gives off naturally. • Useful in identifying shale and clay-filled formations • Neutron Log: • Sends Neutrons through the formation, when they collide with hydrogen it slows them down. This slowness is recorded when a lot of hydrogen is present in the formation.
Acoustic Logs • Acoustic/Sonic Log: • Sonde emits a sound wave through the formation that is recorded. • How fast the sound travels depends on the density of the rock. • The more porous the rock the faster the sound waves travel.
Sample Logs • Physical samples of the well bore. • Typically Two Types: • Core Samples • Cutting Samples
Core Samples • Core: Slender column of rock that shows the sequence of rock as they appear within the earth. • Coring Bit: Substituted for the drilling bit, it has a hollow center that enables the recovery of a sample. • Typically length ranges from 25 to 60 feet. • When it is brought to the surface it is packaged and sent to a lab for analysis.
Cutting Samples • Cuttings: rock that is broken up from the well bore. • As the cuttings flow out of the hole they are recovered by geologist/mud engineers and studied. • Not all cuttings come from the bottom, some are sloughed off from the sides at various depths. • Not as accurate as a core sample, but it is still widely used and offers useful data to geologists/mud engineers regarding the condition and characteristics of the hole.
Drill Stem Test • Drill Stem Test (DST): • Primary way to test a formation that has just been drilled. • Formation fluids flow into perforated holes in the tool where the pressure is recorded . • When the pressure is recorded valves inside the tool close trapping the fluid inside the tool to be used later as a sample for analysis
Drill Stem Test Seals off well bore for reading only formation fluid Formation Fluid and Pressure Fluid is trapped inside once measurements have been made
Strat Test • Stratigraphy: • The study of the origin, composition, distribution, and sequence of rock strata. • Strat Test: • Drill a hole primarily to obtain geological information, mainly in exploration work. • Borehole that exposes complete sections of formations • Stratographers analyze the cuttings to create a cutting log and look for hydrocarbons. • Geologist try to follow beds of rock from well to well.
Stratigraphic Correlation • Stratigraphic Correlation: • The process of comparing geological formations. • Scientists use data from other wells and compare them to predict other sources (formations) of hydrocarbons. • Use of drillers logs, sample logs, electrical logs, composition of formations, and area data are common methods. • Sequence Stratigraphy: • Scientist use seismic surveys and deduce how the environment existed when a rock layer first formed.
Maps • Base Maps • Show existing wells, property lines, roads, buildings and other man made features. • Topographic Maps • Show surface features such as mountains and valleys • Bouger Gravity Map • Underground formations developed from gravity surveys.
Contour Maps (see pg. 43) • Depicts geologic structure and thickness of formations • Structural Map • Depicts the depth of a specific formation from the surface of the formation • Isopach Map • Shows the thickness of a formation. Used mainly to calculate how much hydrocarbon remains in a formation. • Lithofacies Map • Shows the character of the rock itself and how it varies horizontally within the formation. • Biofacies Map: Shows the variations in occurrence of fossil types
Vertical Cross Sections • Represents a portion of the crust as though it were sliced • Shows the structures and fault patterns • Show anticlinal and fault traps • Horizontal variations I type and thickness of rock
Questions • 1. When do oil companies typically drill an exploration well? • 2. List the two typical types of well logs. • 3. List the three types of wire line logs. • 4. What is a sonde? • 5. List the two types of sample logs typically used. • 6. What is the difference between a coring bit and standard drilling bit. • 7. Define cuttings. • 8. What is a DST? • 9. Define stratography. • 10. List the three types of maps commonly used in the oil industry.