Download
1 / 1
10 likes | 113 Views
No. 152. Population based analysis of the trends of Prostate S pecific A ntigen (PSA) use in Australia. Weranja Ranasinghe 1,2 , Simon P. Kim 3 , Nathan Lawrentschuk 1 , Shomik Sengupta 1 , Luke Hounsome 4 , Jim Barber 5 , Richard Jones 6 , Paul Davis 7 , Damien Bolton 1 , Raj Persad 8

E N D
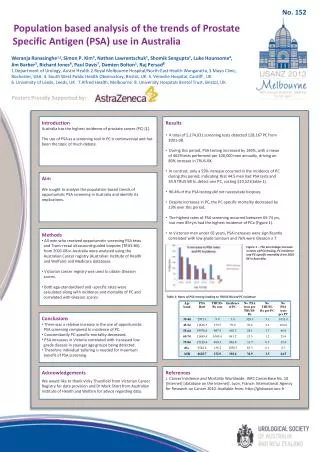
No. 152 Population based analysis of the trends of Prostate Specific Antigen (PSA) use in Australia Weranja Ranasinghe1,2,Simon P. Kim3, Nathan Lawrentschuk1, Shomik Sengupta1, Luke Hounsome4, Jim Barber5, Richard Jones6, Paul Davis7, Damien Bolton1, Raj Persad8 1.Department of Urology, Austin Health 2.Royal Melbourne Hospital/North-East Health Wangaratta, 3.Mayo Clinic, Rochester, USA. 4. South West Public Health Observatory, Bristol, UK 5. Velindre Hospital, Cardiff , UK 6. University of Leeds, Leeds, UK 7.Alfred Health, Melbourne 8. University Hospitals Bristol Trust, Bristol, UK. Posters Proudly Supported by: Introduction Australia has the highest incidence of prostate cancer (PC) [1]. The use of PSA as a screening tool in PC is controversial and has been the topic of much debate. • Results • A total of 5,174,031 screening tests detected 128,167 PC from • 2001-08. • During this period, PSA testing increased by 146%, with a mean • of 4629 tests performed per 100,000 men annually, driving an • 80% increase in TRUS-BX. • In contrast, only a 59% increase occurred in the incidence of PC • during this period, indicating that 44.5 men had PSA tests and • 34.9 TRUS-BX to detect one PC, costing $10,521(table 1). • 96.4% of the PSA testing did not necessitate biopsies. • Despite increases in PC, the PC-specific mortality decreased by • 13% over this period. • The highest rates of PSA screening occurred between 65-74 yrs, • but men 85+yrs had the highest incidence of PCa (Figure 1). • In Victorian men under 65 years, PSA increases were significantly • correlated with low grade tumours and 76% were Gleason ≤ 7. Aim We sought to analyse the population-based trends of opportunistic PSA screening in Australia and identify its implications. • Methods • All men who received opportunistic screening PSA tests • and Trans-rectal ultrasound-guided biopsies (TRUS-BX) • from 2001-08 in Australia were analysed using the • Australian Cancer registry (Australian Institute of Health • and Welfare) and Medicare databases. • Victorian cancer registry was used to obtain Gleason • scores. • Both age-standardised and -specific rates were • calculated along with incidence and mortality of PC and • correlated with Gleason scores. Figure 1 – The percentage increase in rates of PSA testing, PC incidence and PC-specific mortality from 2001-08 in Australia. Table 1: Rates of PSA testing leading to TRUSS-BX and PC incidence • Conclusions • There was a relative increase in the use of opportunistic • PSA screening compared to incidence of PC. • Concomitantly PC-specific mortality decreased. • PSA increases in Victoria correlated with increased low • grade disease in younger age groups being detected. • Therefore individual tailoring is needed for maximum • benefit of PSA screening. Acknowledgements We would like to thank Vicky Thursfield from Victorian Cancer Registry for data provision and Dr Mark Short from Australian Institute of Health and Welfare for advice regarding data. References 1. Cancer Incidence and Mortality Worldwide: IARC CancerBase No. 10 [Internet] [database on the Internet]. Lyon, France: International Agency for Research on Cancer 2010. Available from: http://globocan.iarc.fr .