1 / 22

NOAA Gulfstream IV

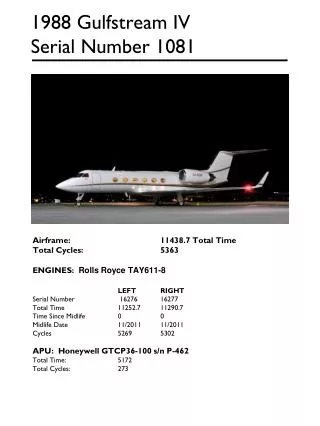
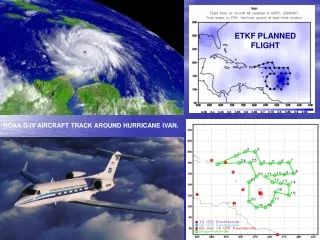
Composite cross section analysis for 0000 GMT 16 April 1976 along the line AA ´ of Fig. 7. Wind speed (m s-1), heavy dashed lines; potential temperature (K), solid lines. Flight path, light dashed lines with GMT hours, solid circles. —. NOAA Gulfstream IV.

ugo
Download Presentation

NOAA Gulfstream IV

An Image/Link below is provided (as is) to download presentation Download Policy: Content on the Website is provided to you AS IS for your information and personal use and may not be sold / licensed / shared on other websites without getting consent from its author. Content is provided to you AS IS for your information and personal use only. Download presentation by click this link. While downloading, if for some reason you are not able to download a presentation, the publisher may have deleted the file from their server. During download, if you can't get a presentation, the file might be deleted by the publisher.

E N D

Presentation Transcript


  1. Composite cross section analysis for 0000 GMT 16 April 1976 along the line AA´ of Fig. 7. Wind speed (m s-1), heavy dashed lines; potential temperature (K), solid lines. Flight path, light dashed lines with GMT hours, solid circles. —

  2. NOAAGulfstream IV

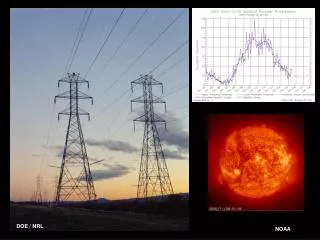
  3. Potential Temperature (4-K interval) 20 km 10 km Surface COAMPS (20 km x 200 m) James Doyle (NRL/Monterey)

  4. 20 km 10 km Surface

  5. Geopotential height (m) and wind speed (m/s) 500 hPa 300 hPa Polar Jet Subtropical Jetstream

  6. 5-6 Feb 1999 theta cross section

  7. 8-9 Feb 1999 theta cross section

  8. 8-9 Feb 1999 winds

  9. 8-9 Feb 1999 DTF turbulence

  10. 1544 UTC 5 Jan. 2003 ^ ^ ^ ^ ^

  11. East Greenland

  12. East Greenland

More Related