Download
1 / 24
240 likes | 368 Views
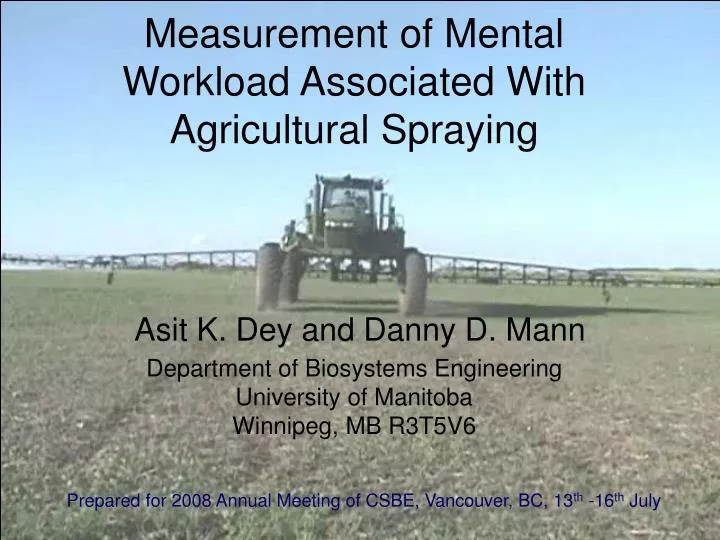
Measurement of Mental Workload Associated With Agricultural Spraying. Asit K. Dey and Danny D. Mann. Department of Biosystems Engineering University of Manitoba Winnipeg, MB R3T5V6. Prepared for 2008 Annual Meeting of CSBE, Vancouver, BC, 13 th -16 th July.

E N D
Measurement of Mental Workload Associated With Agricultural Spraying Asit K. Dey and Danny D. Mann Department of Biosystems Engineering University of Manitoba Winnipeg, MB R3T5V6 Prepared for 2008 Annual Meeting of CSBE, Vancouver, BC, 13th -16th July
Results Introduction Objective Methodology Conclusions Acknowledgement Two Major Tasks of Agricultural Spraying • Task 1: Steering a sprayer along a predefined path in response to a navigation device (PT) Predefined Path
Results Introduction Objective Methodology Conclusions Acknowledgement • Task 2: Monitoring and controlling the rear- attached boom (ST) Joystick Boom
Results Introduction Objective Methodology Conclusions Acknowledgement Key findings of our previous study* • Agricultural spraying is a dynamic dual task (i.e. driving and monitoring) conducted under day, dusk, and night illumination levels. • A sprayer operator sprays 16.5 h in a day that includes all the above changing environments. • Moreover, various terrain conditions (i.e., rolling, flat, or field with obstacle) imposes additional difficulty. *Dey, A and D. Mann. 2008. A complete task analysis to measure the workload associated with operating an agricultural sprayer equipped with a navigation device. Submitted to Applied Ergonomics.
Results Introduction Objective Methodology Conclusions Acknowledgement Key findings of our previous study (contd.) • Most of the sprayer operators use a GPS lightbar to guide the sprayer along a pre-defined path. • The modern cabs are equipped with a mapping display, application display, entertainment unit, and two-way radio communication unit.
Results Introduction Objective Methodology Conclusions Acknowledgement • Event detection and driving performance degrades whenever new information cues are introduced in the operators cab (Boer 2000). • Degradation in driving performance will result in more skips and overlaps of crop inputs. • Degradation in event detection may be linked to the safety of the operators. Boer, E.R. 2000. Behavioral entropy as an index of workload. In Proceedings of the IEA 2000/HFES 2000 Congress, 3/125-3/128, San Diego, CA.
Results Introduction Objective Methodology Conclusions Acknowledgement • The degradation of the driving performance can be minimized and operators comfort and safety can be enhanced by approaching a human centric design. • The study of mental workload helps us achieving the above goal. • Till today, there is no published literature that explored the effect of illumination, terrain difficulty, and task levels on the mental workload of an agricultural sprayer operators.
Results Introduction Objective Methodology Conclusions Acknowledgement Mental Workload Definition: The proportion of mental resources invested to meet task demand. • Excessive workload can affect selective attention, lead towards in-efficient sampling, and results in poor performance. • Therefore, the role of a design engineer should be to keep the mental workload in an optimum zone below the workload redlines.
Results Introduction Objectives Methodology Conclusions Acknowledgement • To investigate the effect of illumination (day and night), difficulty (low and high), and task levels (Single vs. Dual) on the mental workload of agricultural sprayer operators guiding a sprayer in response to a GPS lightbar.
Inside of the Driving Simulator Rear Display Simulation of the Field View Results Introduction Objective Methodology Conclusions Acknowledgement Agricultural Driving Simulator • The participants drove a fixed-base agricultural • driving simulator in response to a red commercial lightbar. • The simulator was equipped with a torque and visual • feedback unit
Results Introduction Objective Methodology Conclusions Acknowledgement • Participants 16 male university graduate students. • Age Group <25 (8), 26-30 (2), 31-40 (3), 41-60 (3) • Training: participants were trained to drive the above tractor simulator.
Results Introduction Objective Methodology Conclusions Acknowledgement Mental Workload Measurement Mental workload was measured by: • Driving performance: lateral root mean square error (cm). • Monitoring Performance: Reaction Time (s) • 0.1 Hz power of hear rate variability (a.u.) • Dynamic Spectrogram • P300 latency (s) • Eye-glance behaviour (% time spent) • NASA-Task Load Index and Simplified subjective workload assessment technique (SSWAT) (a.u.)
Results Introduction Objective Methodology Conclusions Acknowledgement Experimental Design 5 min 5 min • Each participant received 12 randomized sessions. • The experimental time was 3 h/participant.
Results Results Introduction Introduction Objective Objective Methodology Methodology Conclusions Conclusions Acknowledgement Acknowledgement Percentage change in workload measures due to change in illumination and difficulty levels Da= day, N= night, L= low, and H= high
Results Results Introduction Introduction Objective Objective Methodology Methodology Conclusions Conclusions Acknowledgement Acknowledgement Percentage change in workload measures due to change in task levels PT= primary task, ST= secondary task, DT= dual task, n.a.= not applicable
Results Introduction Objective Methodology Conclusions Acknowledgement Percentage of time spent looking at various sectors (outside, lightbar, left boom, right boom) for day (DA) and night (N) illumination, and low (L) and high (H) difficulty levels under driving only condition
Results Introduction Objective Methodology Conclusions Acknowledgement Percentage of time spent looking at various sectors (outside, lightbar, left boom, right boom) for day (DA) and night (N) illumination, and for low (L) and high (H) difficulty levels under monitoring only condition.
Results Introduction Objective Methodology Conclusions Acknowledgement Percentage of time spent looking at various sectors (outside, lightbar, left boom, right boom) for day (DA) and night (N) illumination, and for low (L) and high (H) difficulty levels under dual task condition.
DTDAL PTDAL Results Introduction Objective Methodology Conclusions Acknowledgement DTDAH PTDAH DTNL PTNL DTNH PTNH Fig. 7. Dynamic spectrogram of average HRV data under driving only (PT), monitoring only (ST), and dual task condition (DT) for low (L) and High (H) difficulty levels, and day (DA) and night (N) illumination levels. PTDAL = driving only task under day driving and low difficulty levels.
DTDAL STDAL Results Introduction Objective Methodology Conclusions Acknowledgement DTDAH STDAH DTNL STNL DTNH STNH
Results Introduction Objective Methodology Conclusions Acknowledgement Conclusions • The performance measures, P300 latency, subjective rating scales showed a trend that night illumination was more demanding. The main effect of illumination was significant for P300. • Similarly, the above measures showed that high difficulty was more demanding. Only the P300 and SSWAT was able to differentiate between low and high difficulty at p<0.05. • The 0.1 Hz HRV data showed driving under day illumination or under low difficulty were more demanding.
Results Introduction Objective Methodology Conclusions Acknowledgement Conclusions (contd.) • Spectrogram showed that PT and DT under day driving, and ST under night driving was more demanding. Moreover, low difficulty was more demanding than day driving. • All the measures significantly revealed that the dual task was more demanding than single task level. • Under any illumination, difficulty, or task levels (except ST), participant spent more time looking at the lightbar. Therefore, lightbar is an important source of guidance information.
Results Introduction Objective Methodology Conclusions Acknowledgement • U of M Graduate Fellowship • Department of Biosystems Engineering of the University of Manitoba. • Participants