Probability and Reliability
Explore key concepts of probability and reliability, including occurrence, Venn diagrams, conditional probabilities, independent events, binomial distribution, reliability functions, and more. Enhance your understanding with detailed examples and calculations.


Probability and Reliability
E N D
Presentation Transcript
Probability and Reliability Thirteen Meeting
Probability: Occurrence • Process has more than one outcome • Occurrence of event Ei • is the number of times, Ni, that Ei occurs out of a total number, N, of events. • r = number of events • Example: • E1 = picking a red ball • E2 = picking a greenball • E3 = picking a blackball • N1 = 2 • N2 = 3 • N3 = 2 • N= N1 + N2 +N3 = 7 • r= 3
Probability: Relative Frequency or Probability • It is the frequency of occurrence of an event • It is the frequency of occurrence of an event Ei • N = N1+ N2 + …+ Nr-1 + Nr • P(E1) + P(E2) + …+ P(Er-1) + P(Er) = 1
Probability: Probability Example • r = 3 • E1= Picking a red ball • E2= Picking a green ball • E3= Picking a black ball • N1 = 2 • N2 = 3 • N3 = 2 • N = 2 + 3 + 2 = 7 • P(E1) = 2/7 • P(E2) = 3/7 • P(E3) = 2/7 • 2/7 + 3/7 + 2/7 = 1
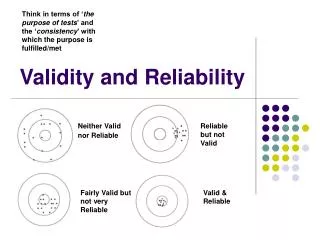
Venn Diagram • S = The total area covered by a Venn diagram represents all the events • E = The frequency of a specific event corresponds to a given area of the diagram • The ratio (area of E)/(area of S) = the probability of the event E occurring.
No Occurrence Event • P(E) is the probability that event E occurs • P( Ē ) is the probability that the event does not occur • P( E ) + P( Ē ) = 1 • Example • E1= Picking a red ball • N1 = 2 • N = 7 • P(E1) = 2/7 • P(Ē1) = 5/7
S S B S P(B) A A or B B B A AB A And/Or Probabilities • P(AB) (joint probability) is the Probability that events A and B will both occur. • What is P(AB) if A and B Mutual Exclusive • P(AB) = 0 • P(A OR B) is the probability that event A, or event B, or both event A and event B will occur. • P( A OR B ) = P( A ) + P( B) - P(AB)
S = 100 S S = 100 B = 20 B = 20 B = 30 A=10 A = 25 A = 25 Examples P( A OR B ) = P( A ) + P( B) – P(AB) P( A OR B ) = 10/100 + 30/100 – 10/100 = 30/100 S = 100 B = 30 A=10 P( A OR B ) = P( A ) + P( B) – P(AB) P( A OR B ) = 25/100 + 20/100 – 0/100 = 45/100
Conditional Probabilities S • P( A | B) • A occur if B has definitely occurred. • P( A | B) = P(AB)/P(B) • Example: • P(T|C) = P(TC)/P(C) • P(T|C) = 0.08/0.4 = 0.2 T C CT
Independent Probabilities • Independent events • The occurrence of one event does not affect the probability of occurrence of the other. • P( A | B) = P( A) for independent events A and B • Example • Are events C and T independent • P(T) = P(T|C) must be true • P(T|C) = P(TC)/P(C) • P(T|C) = 0.08/0.4 = 0.2 • P(T) = 0.15 • The answer is NO C T CT
Independent Probabilities (cont.) • Example • Are events C and T independent • P(T) = P(T|C) must be true • P(T|C) = P(TC)/P(C) • P(T|C) = 0.06/0.4 = 0.15 • P(T) = 0.15 • The answer is YES
Multiplication Probabilities • P(AB) = P( A|B) P( B) • If A and B are independent events, • P(AB) = P( A) P( B) • Example: • P(TC) = P( T|C) P( C) • P(T|C) = P(TC)/P(C) • P(T|C) = 0.08/0.4 = 0.2 • P(TC) = 0.2 * 0.15 • P(TC) = 0.03
Binomial Distribution • Employee receives phone calls • 40% of phone calls = Cell phone (p) • 60% of phone calls = Ground phone (q) • Event that 2 out 3 = Cell phone (r) • What is P(r) • p = 0.4 • q = 0.6 • n = 3 • P(r) = ? 6! = 6 * 5 *4 * 3 * 2 * 1
Binomial Distribution • You send 10 postcards from 10 different towns • 1% of mail is lost • What is the probability that 3 of 10 postcards won’t arrive • Lost mail = • 0.01 = p • Received mail = • 0.99 = q • Total number of events = • 10 = n • Event 3 of 10 are lost = • 3 = r
Binomial Coefficient • nCr is Binomial coefficient
Binomial Coefficient Row 2 corresponds to 1C0 and 1C1. Row 3 corresponds to 2C0 , 2C1, and 2C2. What 10C7 = 120
Reliability Function • R(t), is the probability that a component will survive to time t. • This can be estimated by a test of N0 components: • Ns(t) is the number of components surviving at time t.
Reliability Function • Q(t), is the probability that a component will fail to time t. • This can be estimated by a test of N0 components: • Nf(t) is the number of components failing at time t.
Failure Density Function • ƒ(t). The probability of failing, ΔQ(t), during a very small interval Δt at t can be expressed as: • ΔQ(t) = ƒ(t) Δt
Continuous Function • Reliability function R(t) and failure function Q(t), the relationship to the failure density function ƒ(t) can be found by differentiation: • Equivalently, Q(t) and R(t) can be found by integrating ƒ(t):
Reliability Function Definitions • This is known as the normalization condition. • R(t) and Q(t) is called • cumulative probability distributions • because they give the probability of something happening up to a specified time. • ƒ(t) is called: • probability density function • because it is used to give the probability of failure during an interval of time • h(t) is called: • hazard rate, or failure rate • is the ratio of the number of failures per unit time, at time t, to the number of components exposed to failure at that time:
Hazard Rate Plot • Burn-in period (early life ) • A steep fall in the and it is when faulty components are weeded out), • Useful life period (or normal operating period) • a level when h(t) is effectively constant, • Wear-out (or end-of-life period) • when the hazard rate rises steeply. • The hazard rate is also related to the failure density function and the reliability function by the equation:
Exponential Probability Distribution • When h is constant, the R(t) and f(t) are simply: • R(t ) = exp(-ht ) = e-ht • f (t ) = h exp(−ht ) = h*e-ht
Average Lifetimes: MTTF • Mean Time To Failure (MTTF) • The average lifetime of a batch of components • Example • if N1 failed at time t1, N2 failed at time t2, …etc., then: • If h is constant, then 10d=5,20d=6,30=4 50+120+120/15
Average Lifetimes: MTBF, MTTR and availability • Mean Time Between Failure (MTBF) • Is used for repairable components (no MTTF) • Is the average time from when a component starts to be operational until it fails • Mean Time To Repair (MTTR) • is the mean time taken to repair a fault. • Availability, A: