Download
1 / 1
10 likes | 142 Views
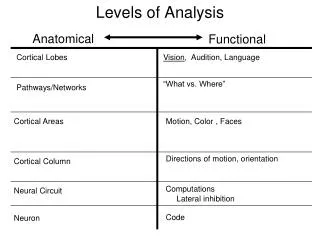
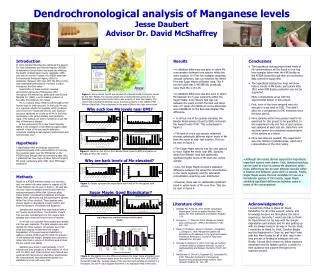
Why such low Mn levels near EMI?. Figure 2. Graphs on the left are from Bender Road (closet to EMI) and graphs on the right are from the control. Why are bark levels of Mn elevated?. Figure 3. Graphs represent the unpredicted high levels of Mn throughout bark samples.

E N D
Why such low Mn levels near EMI? Figure 2. Graphs on the left are from Bender Road (closet to EMI) and graphs on the right are from the control. Why are bark levels of Mn elevated? Figure 3. Graphs represent the unpredicted high levels of Mn throughout bark samples. Sugar Maple: Good Bioindicator? Figure 4. Top graphs show the difference between the Sugar Maple at Bender Road and the control. The bottom graph shows the trend in Mn levels from 1978-2008 at the Bender Road site. Average values of the east and west samples are plotted in a line graph; the low R2 value suggest that there is no statistical trend in Mn levels. Dendrochronological analysis of Manganese levelsJesse DaubertAdvisor Dr. David McShaffrey Introduction In 2000, Senator Mike Dewine petitioned the Agency for Toxic Substances and Disease Registry (ATSDR) to determine if air pollution was adversely affecting the health of Washington County residents.1 With only one air monitor in place, the ATSDR asked the Environmental Protection Agency (EPA) for assistance. Between 2000 and 2007 the EPA put five total suspended particulate air monitors in place throughout the Ohio valley.1 Examination of these monitors revealed abnormally high levels of Manganese (Mn) throughout the ambient air, particularly near Eramet Marietta Inc. (EMI), a world leading producer of ferroalloy Mn hardeners for metals. Mn is a natural heavy metal found throughout the human body in small amounts. In the body, Mn acts as a required cofactor for arginase, which produces urea in the liver.2 Acute and chronic over exposure has been attributed to a build up of Mn in the brain, particularly in the globus pallidus and substantia nigra.5 This buildup can lead to symptoms much like that of Parkinson's disease. In the environment Mn is also found naturally, aiding in the transport of nutrients throughout plant material. A lack of Mn can lead to deficiency symptoms resulting in leaf pigment malformation and total biomass loss.3 Hypothesis I hypothesized that my findings would show proportional levels of Mn concentrations in tree ring bore samples taken near the EMI facility as the ATSDR found through their air monitoring data. Also, I predicted that tree rings will show historic trends in Mn levels, particularly after 1951 when EMI began production. • Results • A statistical difference was seen in xylem Mn concentration between tree species within the same location. A t-Test: two samples assuming unequal variances, was run between the White Pine and Sugar Maple at Bender road. The P two tail value was 1.40339E-08; drastically lower than the α of 0.05. • A statistical difference was also seen in xylem Mn between the 5 year segments within the Sugar Maple. A Chi Square test was run between the years on both the East and West side. A P value of 6.0281E-24 on the West side and 4.9928E-28 on the East side displays this difference. • In all but one of the species sampled, the Bender Road species (closet to EMI) contained the lowest levels of Mn. This is displayed in figure 2. • The bark of every tree species examined showed statistically different higher levels of Mn than the xylem at each test location. This can be seen in figure 3. • The Sugar Maple species was the only species to show higher Mn levels near EMI. Samples taken from Bender road had statistically significant higher levels of Mn than the control sample. • Also, the Sugar Maple showed a statistical difference between the actual Mn concentration in the xylem segments and the estimated concentration assuming even distribution. • However, there was no statistically significant trend in xylem levels of Mn over time. This can be seen in figure 4. • Conclusions • The hypothesis stating proportional levels of Mn concentrations will be found in tree ring bore samples taken near the EMI facility as the ATSDR found through their air monitoring data cannot be supported. • The hypothesis stating tree rings will show historic trends in Mn levels, particularly after 1951 when EMI began production can not be supported. • Many complications arose with the experimental design of this project. • First, none of the trees sampled were old enough to trace back to 1951. This didn’t allow for a comparison to EMI emissions since this time period. • More samples within tree species need to be examined for this project to be quantified. In this experiment only one tree of each species was sampled at each test site. Data from only one tree cannot be considered representative of the species as a whole. • More test sites are needed. This experiment was only testing 2 polluted areas, which isn’t representative of the Ohio Valley. Figure 1. Arrow closest to EMI was located off of Bender Road at property owned by Kris Marr Reality. The second sample site is located directly across from the Washington County Career Center and is also property of Kriss Marr Reality. The control site is located in Ashland County at private property in the middle of the Mohican State Park. This is displayed in the map of Ohio in the right hand corner. • Although the results did not support the hypothesis, important lessons were drawn. First, dendrochronology can be used as a tool to assess Mn dispersion within trees. Differences can be seen between species within a location and between years within a species. Finally, Sugar Maple seems the best candidate for use as a bioindicator species of Mn toxicity. Sugar Maple exhibited significant differences between years in terms of Mn concentrations. Methods Based on a ATSDR emission model, two test sites and one control site were chosen in regards to EMI. These locations can be seen in figure 1. At each site two tree ring core samples were excised from the angiosperm species White Oak (Quercus alba), Yellow Poplar (Lireodendron tulipifera), and Sugar Maple (Acer sacchrum) and the gymnosperm species White Pine (Pinus strobus). These species were chosen based on abundance in each location and from the literature of Kennedy and Bergeron.4 Samples were excised from each species with a 16’’ Suunto increment bore. The diameter of each tree was also recorded and one inch square bark samples were removed from the area of excision. In the lab, core samples were sanded and divided into five year segments. The bark samples were also divided into three sections. All samples were then dried and weighed to determine dry weight. Degradation of the wood was accomplished by adding a volume of Nitric acid 20 times the amount of the samples dry weight. Samples were allowed to reflux fully, then a volume of Perchloric acid 4 times the dry weight was added. Samples were dried to approximately 1 ml of solution and then brought to a final solution of 10 ml with 2% Nitric acid. Final solutions were filtered and analyzed with flame atomic absorption spectroscopy. Mn concentrations were determined based on a standard curve ran with every trial. • Literature cited • Colledge MA, Freed JA. 2007. Health consultation Washington County air quality Marietta, Ohio. Agency for Toxic Substances and Disease Registry. 1-30. • Crossgrove J, Zheng W. 2004. Manganese toxicity upon overexposure. NMR in Biomedicine 17 (8): 544 - 553. • Kejian P, Chunling L, Wuxin Y, Chunlan L, Xiangdong L, Zhenguo S. 2008. Manganese uptake and interactions with cadmium in the hyperaccumulator. Phytolacca Americana L Journal of Hazardous Materials 154: 674–681. • Kennedy G, Bergeron S. 1991. Tree rings as monitors of heavy metal air pollution histories. Journal of Radioanalytical and Nuclear Chemistry 151(2): 337- 343. • Prabhakaran K, Ghosh D, Chapman GD, Gunasekar PG. 2008. Molecular mechanism of manganese exposure-induced dopaminergic toxicity. Brain Research Bulletin 76: 361–367 Acknowledgments I would first off like to thank Dr. David McShaffrey for all of the support, advice, and knowledge he gave me throughout this entire experience. Secondly, I would also like to thank Dr. David Brown for his help with the sample degradation and analysis and for also putting up with me always being in his way in the lab. Next, I would like to thank Dr. Fitch, Caroline Beidler and the Neighbors for Clean Air, and Patti Finkel with Kris Marr Reality for all of their help in the long process of finding an adequate test site. Finally, I would like to thank my fellow capstone classmates and Dr. Spilatro and Dr. Lustofin for their guidance and support throughout my capstone project.