business analytics online course
250 likes | 269 Views
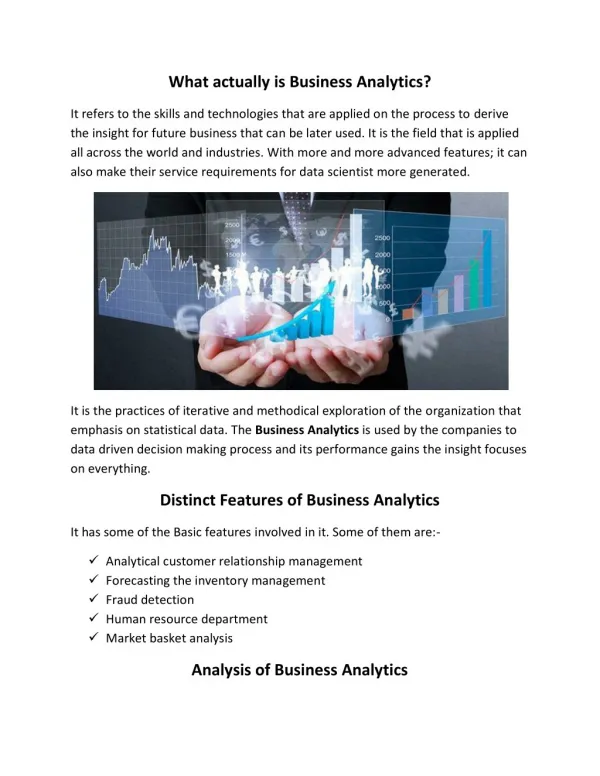
If you are confused about the training institute for business analytics online course. Your Confusion Ends here, ExcelR Solutions at Hyderabad and Bangalore providing business analytics online course Training with the trainers from IIT and ISB, Providing real time projects to every individual. ExcelR offers 100% Placment assistance. Every Course if offered at budget friendly.

business analytics online course
E N D
Presentation Transcript
Cluster Analysis: A practical example 1
Content Introduction: the necessity to reduce the complexity Recall: what cluster analysis does An example : cluster analysis in consumer research on fair trade coffee Discussion 2
Intro (…) “Where is the life, we have lost in living? Where is the wisdom, we have lost in knowledge? Where is the knowledge, we have lost in information?” (…) T. S. Elliot, Choruses from the Rock (1888 – 1965)
Intro (…) Where is the wisdom, we have lost in knowledge? Where is the knowledge, we have lost in information? (…) “Where is the information we have lost in data?”
Intro In order to go from data to information, to knowledge and to wisdom, we need to reduce the complexity of the data. Complexity can be reduced on - case level : cluster analysis - on variable level: factor analysis
What cluster analysis does Cluster analysis can get you from this: a b c d e f To this:
What cluster analysis does Cluster analysis • generate groups which are similar • homogeneous within the group and as much as possible heterogeneous to other groups • data consists usually of objects or persons • segmentation based on more than two variables
What cluster analysis does Cluster analysis • generates groups which are similar • the groups are homogeneous within themselves and as much as possible heterogeneous to other groups • data consists usually of objects or persons • segmentation is based on more than two variables
What cluster analysis does Examples for datasets used for cluster analysis: • socio-economic criteria: income, education, profession, age, number of children, size of city of residence .... • psychographic criteria: interest, life style, motivation, values, involvement • criteria linked to the buying behaviour: price range, type of media used, intensity of use, choice of retail outlet, fidelity, buyer/non-buyer, buying intensity
What cluster analysis does Proximity Measures • Proximity measures are used to represent the nearness of two objects • relate objects with a high similarity to the same cluster and objects with low similarity to different clusters • differentiation of nominal-scaled and metric-scaled variables m d(yi,ys) = [∑ |yij-ysj|r]1/r j=1 y = vector i,s = different objects j = the different characteristics r = changes the weight of assigned distances the calculation of the distances measures is the basis of the cluster analysis.
What cluster analysis does Two phases: 1. Forming of clusters by the chosen data set – resulting in a new variable that identifies cluster members among the cases 2. Description of clusters by re-crossing with the data
What cluster analysis does Cluster Algorithm in agglomerative hierarchical clustering methods – seven steps to get clusters 1. each object is a independent cluster, n 2. two clusters with the lowest distance are merged to one cluster. reduce the number of clusters by 1 (n-1) 3. calculate the the distance matrix between the new cluster and all remaining clusters 4. repeat step 2 and 3, (n-1) times untilall objects form one reminding cluster
What cluster analysis does Finally… 1. decide upon the number of clusters you want to keep (decision often based on the size of the clusters) 2. description of the clusters by means of the cluster- forming variables 3. appellation of the clusters with catchy titles
What cluster analysis does Cluster 3 Cluster 4 Cluster 5 Cluster 1 Cluster 2
Practical Example Consumers and Fair Trade Coffee (1997!) 214 interviews of consumers of fair trade coffee (personal and telephone interviews) Cluster analysis in order to identify consumer typologies Identification of 6 clusters Description of these clusters by further analysis: comparison of means, crosstabs etc.
Consumers and Fair Trade Coffee Description of clusters: Cluster 1 (11,6%): “self-oriented fair trade buyer” Cluster 2 (13,6%): “less ready to take personal constraints” Cluster 3 (18,2%): ”less engaged about fair trade” Cluster 4 (32,2%): “intensive buyer” Cluster 5 (18,7%): “value-oriented” Cluster 6 (5,6%): “does not like the taste of fair trade coffee”
Consumers and Fair Trade Coffee Description of Cluster 1 (11,6%): “self-oriented fair trade buyer” : Searches satisfaction by doing the good thing Is not altruistic Buys occasionally Sticks to his conventional coffee brand High level of formal education Frequently religious (catholic or protestant)
Consumers and Fair Trade Coffee Description of Cluster 2 (13,6%): “less ready to take personal constraints” States that “fair trade coffee is hard to find” Feels responsible for fare development issues Believes that fair trade is efficient for developing countries Is less ready to go to special fair trade outlets Buys conventional coffee Likes the taste of fair trade coffee
Consumers and Fair Trade Coffee Description of clusters Cluster 3 (18,2%): ”less engaged about fair trade” : Feels no personal responsibility with regard to development questions Doesn’t see the efficiency of the consumption of fair trade goods The only thing that can make him change is the influence of friends Is older then the average fair trade buyer and has less formal education
Consumers and Fair Trade Coffee Description of clusters: Cluster 4 (32,2%): “intensive buyer” Has abandoned conventional coffee brands Has started to buy fair trade quite a while ago (> 3 years) Shops frequently in fair trade stores (and not in organic retail) Is ready to act for fair development and talks to friends about it Relatively young, with low incomes and high educational values
Consumers and Fair Trade Coffee Description of clusters: Cluster 5 (18,7%): “value- oriented” Together with cluster 4 highly aware of development issues Ready to act and to constraint consumption habits Buys for altruistic reasons Highly involved in social / political action Most frequently women, highest household income among all clusters Own security is the basis for solidary action
Consumers and Fair Trade Coffee Description of clusters: Cluster 6 (5,6%): “does not like the taste of fair trade coffee” Lowest purchase intensity of all clusters Not willing to accept constraints in consumption habits or higher prices Most members of these group are attached to a conventional coffee brand Relatively high incomes, age within the average of all groups, lower level of formal education Less religious than other groups.
Conclusion / discussion Advantages • no special scales of measurement necessary • high persuasiveness and good assignment to realisable recommendations in practice Disadvantages • choice of cluster-forming variables often not based on theory but at random • determination of the right number of clusters often time- consuming – often decided upon arbitrarily • high influence on the interpretation of the scientist, difficult to control (good documentation is needed)
Conclusion / discussion
Sources Russell .L. Ackoff, "From Data to Wisdom," Journal of Applied Systems Analysis 16 (1989): 3-9. Milan Zeleny, "Management Support Systems: Towards Integrated Knowledge Management," Human Systems Management 7, no 1 (1987): 59-70. Tashakkori, A. and Ch. Teddlie: Combining Qualitative and Quantitaive Approaches. Applied Social Research Methods Series, Volume 46. Thousand Oaks, London, New Delhi, 1998. xyxy