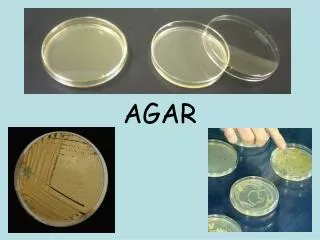
YPD agar
1. 2. 3. 4. 5. 6. 7. 8. 9. 10. 11. 12. 13. 14. 15. 16. 17. 18. 19. 20. 21. 22. 23. 24. A. A. B. B. C. C. D. D. E. E. F. F. G. G. H. H. I. I. J. J. K. K. L. L. M. M. N. N. O. O. P. P. 1. 2. 3. 4. 5. 6. 7. 8. 9. 10. 11. 12. 13. 14.

YPD agar
E N D
Presentation Transcript
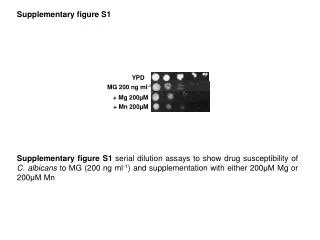
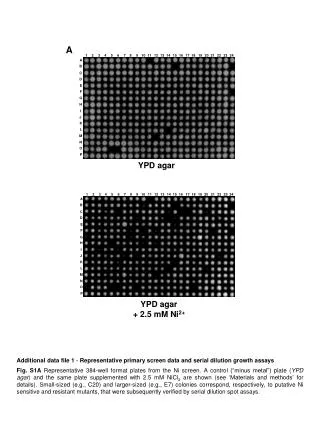
1 2 3 4 5 6 7 8 9 10 11 12 13 14 15 16 17 18 19 20 21 22 23 24 A A B B C C D D E E F F G G H H I I J J K K L L M M N N O O P P 1 2 3 4 5 6 7 8 9 10 11 12 13 14 15 16 17 18 19 20 21 22 23 24 A YPD agar YPD agar + 2.5 mM Ni2+ Additional data file 1-Representative primary screen data and serial dilution growth assays Fig. S1A Representative 384-well format plates from the Ni screen. A control (“minus metal”) plate (YPD agar) and the same plate supplemented with 2.5 mM NiCl2 are shown (see ‘Materials and methods’ for details). Small-sized (e.g., C20) and larger-sized (e.g., E7) colonies correspond, respectively, to putative Ni sensitive and resistant mutants, that were subsequently verified by serial dilution spot assays.
B C Additional data file 1 (Continued) Fig. S1BWild-type (BY4742) and the indicated deletion mutant strains were grown in Ni-free (left) or Ni-containing (right) YPD. Ni sensitivity was determined on cells serially diluted in 10-fold increments (left to right; starting from an OD600 of 1); mutant strains exhibiting a reduction in colony-forming ability at the first, second, or third (or higher) dilution were classified as having a “high” (HS), “medium” (MS) or “low” (LS) sensitivity to Ni. Representative areas from the original 384-well plates are shown in square sections on the left, where the mutant strain subjected to spot assay validation is encircled. Fig. S1C Same as Fig. S1B for Ni resistant mutant strains, which were defined as such when capable of growing at the second (or higher) dilution in the presence of 3.5 mM NiCl2. The same classification criteria were applied to Cd, which was used at 40 M and 50 M concentrations, respectively, for sensitivity and resistance validation assays. The optimum sublethal concentrations of Ni (and Cd) for these screens was determined in preliminary serial dilution/dose assays (see ‘Materials and methods’ for details).