Download
1 / 28
280 likes | 368 Views
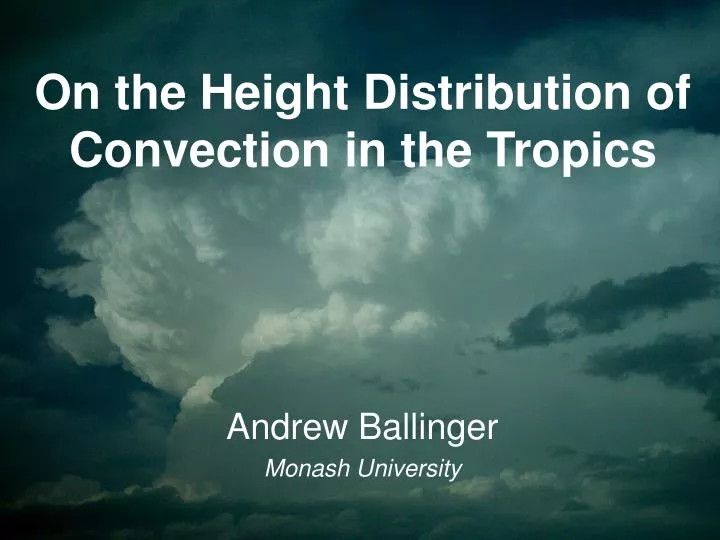
On the Height Distribution of Convection in the Tropics. Andrew Ballinger Monash University. Introduction and Motivation. Variety of convection in the tropics Multi-modal distribution of storm heights? Johnson et al , 1999. May and Rajopadhyaya, 1999. Implications:

E N D
On the Height Distribution of Convection in the Tropics Andrew Ballinger Monash University
Introduction and Motivation • Variety of convection in the tropics • Multi-modal distribution of storm heights? • Johnson et al, 1999. • May and Rajopadhyaya, 1999. • Implications: • Tropospheric/Stratospheric exchange • Storm detrainment heights • Cirrus characteristics • Interpretation of satellite data
Types of Convection Continental • High Z extends well above FZL • Active lightning • Strong vertical motion • “Break” period • Low-level easterlies Oceanic • High Z mostly below FZL • Little lightning • Relatively “small” vertical motion • “Monsoon” period • Low-level westerlies
TITAN Thunderstorm Identification, Tracking, Analysis, and Nowcasting. Reflectivity – 2km Reflectivity – 5km Reflectivity – 10km Reflectivity – 17km Dixon and Wiener, 1993
Storm initiation points (35 dBZ) Monsoon Break
Storm initiation points (45 dBZ) Monsoon Break
2pm 3pm 9am Diurnal cycle of the number of cells (35 dBZ) Monsoon Break
4pm 7am 2pm Diurnal cycle of the number of cells (45 dBZ) Monsoon Break
Distribution of storm max heights 10 10 16 17 14 14 Distribution of storm max heights Monsoon 35 dBZ 45 dBZ Monsoon Tropopause Break 35 dBZ 45 dBZ Break
Break – Diurnal cycle of storm max heights (35 dBZ) 09:30 – 11:30 15:30 – 17:30 11:30 – 13:30 17:30 – 19:30 13:30 – 15:30 19:30 – 21:30
Summary • Convective cells deeper in break compared with monsoon • More intense cells in break period with strong overshoots of the tropopause • Intense cells mostly reach tropopause • In the monsoon period a height distribution max is found at 10km • Diurnal cycle of cell heights shows build up during the day.
References • Dixon, M., and G. Wiener, 1993: “TITAN: Thunderstorm Identification, Tracking, Analysis, and Nowcasting – A Radar-based Methodology”, J. Atmos. Oceanic Technol., 10, 785–797. • Johnson, R.H., T.M. Rickenbach, S.A. Rutledge, P.E. Ciesielski and W.H. Schubert, 1999: “Trimodal Characteristics of Tropical Convection”, J. Clim., 12, 2397–2418. • Keenan, T.D., J. McBride, G. Holland, N. Davidson and B. Gunn, 1989: “Diurnal Variations during the Australian Monsoon Experiment (AMEX) Phase II”, Mon. Wea. Rev., 117, 2535–2552. • López, R.E., 1976: “Radar Characteristics of the Cloud Populations of Tropical Disturbances in the Northwest Atlantic”, Mon. Wea. Rev., 104, 268–283.
Storm Duration Monsoon Total Break
Reflectivity Thresholds (35) 10 dBz 1 dBz 15 dBz 5 dBz
Reflectivity Thresholds (45) 10 dBz 1 dBz 15 dBz 5 dBz
Monsoon/Break Definition Monsoon 21/12/03 – 16/1/04 Break 17/1/04 – 31/1/04
GATE Results ShallowCumulus CongestusCumulus Cumulonimbus
Outline • Introduction and Motivation • Formulation of dataset • Results • Summary
Acknowledgements • Dr Peter May – BMRC • Monash University • Bureau of Meteorology Research Centre