Effort Estimation Based on Collaborative Filtering
Effort Estimation Based on Collaborative Filtering. Naoki Ohsugi, Masateru Tsunoda, Akito Monden, and Ken-ichi Matsumoto. Software Development Effort Estimation. There are methods for estimating required efforts to complete ongoing software development projects.

Effort Estimation Based on Collaborative Filtering
E N D
Presentation Transcript
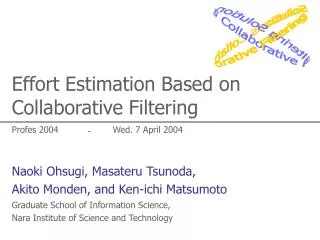
Effort Estimation Based on Collaborative Filtering Profes 2004 Naoki Ohsugi, Masateru Tsunoda, Akito Monden, and Ken-ichi Matsumoto
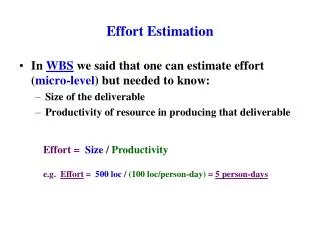
Software Development Effort Estimation • There are methods for estimating required efforts to complete ongoing software development projects. • We can conduct the estimation based on past projects’ data. Cow Profes 2004
Problems in Estimating Effort • Past project’s data usually contain many Missing Values (MVs). • Briand, L., Basili, V., and Thomas, W.: A Pattern Recognition Approach for Software Engineering Data Analysis. IEEE Trans. on Software Eng., vol.18, no.11, pp.931-942 (1992) • MVs give bad influences to accuracy of estimation. • Kromrey, J., and Hines, C.: Nonrandomly Missing Data in Multiple Regression: An Empirical Comparison of Common Missing-Data Treatments. Educational and Psychological Measurement, vo.54, no.3, pp.573-593 (1994) Cow? Horse? ? ? Profes 2004
Goal and Approach • Goal: to achieve accurate estimation using data with many MVs. • Approach: to employ Collaborative Filtering (CF). • Technique for estimating user preferences using data with many MVs (e.g. Amazon.com) Profes 2004
5 (prefer) Estimate Similar User Similar User Dissimilar User CF based User Preference Estimation • Evaluating similarities between the target user and the other users. • Estimating the target preference using the other users’ preferences. Book 2 Book 4 Book 5 Book 1 Book 3 3 (so so) 5 (prefer) 5 (prefer) 1 (not prefer) ? (target) User A 3 (so so) 5 (prefer) 5 (prefer) ? (MV) 5 (prefer) User B ? (MV) ? (MV) 5 (prefer) 5 (prefer) 1 (not prefer) User C 1 (not prefer) 1 (not prefer) ? (MV) ? (MV) 5 (prefer) User D Profes 2004
25 Estimate Similar Project Similar Project Dissimilar Project CF based Effort Estimation • Evaluating similarities between the target project and the past projects. • Estimating the target effort using the other projects’ efforts. # of faults Coding cost Testing cost Project type Design cost 1 (new develop) 60 100 50 ? (target) Project A 1 (new develop) 40 ? (MV) 40 20 Project B ? (MV) 50 80 ? (MV) 30 Project C 0 (maintain) ? (MV) ? (MV) 200 80 Project D Profes 2004
# of faults Project A Project B 0 Project type Coding cost Project A Project B Step1. Evaluating Similarities • Each project is represented as a vector of normalized metrics. • Smaller angle between 2 vectors denotes higher similarity between 2 projects. # of faults Coding cost Testing cost Project type Design cost 1 (1.0) 60 (1.0) 100 (1.0) 50 (0.0625) ? (target) Project A 1 (1.0) 40 (0.0) ? (MV) 40 (0.0) 20 (0.0) Similarity: 0.71 Project B Profes 2004
25 Estimate (k=2) Similarity: 0.71 Similarity: 0.71 Similarity: 0.062 Step2. Calculating Estimated Value • Choosing similar k-projects. • k is called Neighborhood Size. • Calculating the estimated value from weighted sum of the observed values on the similar k-projects. # of faults Coding cost Testing cost Project type Design cost 1 (new develop) 60 100 50 ? (target) Project A 1 (new develop) 40 ? (MV) 40 20 Project B ? (MV) 50 80 ? (MV) 30 Project C 0 (maintain) ? (MV) ? (MV) 200 80 Project D Profes 2004
Case Study • We evaluated the proposed method, using data collected from large software development company (over7,000 employees). • The data were collected from 1,081 projects in a decade. • 13% projects for developing new products. • 36% projects for customizing ready-made products. • 51% projects were unknown. • The data contained 14 kinds of metrics. • Design cost, coding cost, testing cost, # of faults, etc., ... Profes 2004
Unevenly Distributed Missing Values Profes 2004
Evaluation Procedure • We divided the data into 50-50 two datasets randomly; Fit Dataset and Test Dataset • We estimated Testing Costs in the Test Dataset using the Fit Dataset. • We compared the estimated Costs and the actual Costs. Fit Dataset 541 projects Estimated Testing Costs Original Data 1081 projects used divided compared Test Dataset 540 projects Actual Testing Costs extracted Profes 2004
Regression Model We Used • We employed stepwise metrics selection. • We employed the following Missing Data Treatments. • Listwise Deletion • Pairwise Deletion • Mean Imputation Profes 2004
100 100 10 10 1 1 0.1 0.1 Actual Costs Actual Costs 0.01 0.01 0.001 0.001 0.0001 0.0001 0.0001 0.001 0.01 0.1 1 10 100 0.0001 0.001 0.01 0.1 1 10 100 Estimated Costs Estimated Costs Relationships Between the Estimated Costs and the Actual Costs Regression (Listwise Deletion) CF (k = 22) Profes 2004
|Estimated Cost – Actual Cost | Actual Cost Relative Error = Evaluation Criteria of Accuracy • MAE: Mean Absolute Error • VAE: Variance of AE • MRE: Mean Relative Error • VRE: Variance of RE • Pred25 • Ratio of the projects whose Relative Errors are under 0.25. Absolute Error =|Estimated Cost – Actual Cost | Profes 2004
0.89 MRE = 0.82 (k = 22) 0.88 0.87 0.86 0.85 Mean Relative Error 0.84 0.83 0.82 0.81 1 5 10 15 20 25 30 35 40 45 50 Neighborhood Size Accuracy of Each Neighborhood Size • The most accurate estimation was observed atk=22. Profes 2004
Accuracies of CF and Regression Models • All evaluation criteria indicated CF (k=22) was the most effective for our data. Profes 2004
Related Work • Analogy-based Estimation • It estimates effort using values of the similar projects. • Shepperd, M., and Schofield, C.: Estimating Software Project Effort Using Analogies. IEEE Trans. on Software Eng., vol.23, no.12, pp.76-743 (1997) • They had another approach to evaluate similarities between projects. • They never mentioned missing values. Profes 2004
Summary • We proposed a method for estimating software development efforts using Collaborative Filtering. • We evaluated the proposed method. • The results suggest the proposed method has possibility for making good estimation using data including many MVs. Profes 2004
Future Work • Designing the method to find appropriate neighborhood size automatically. • Improving accuracy of estimation by other similarity evaluation algorithms. • Comparing accuracies to another methods (e.g. analogy-based estimation). Profes 2004