CMS CO2 Test Stand Specifications and Installation Status
210 likes | 301 Views
This document outlines the specifications and installation status of the CMS CO2 cooling system with a closed-loop setup cooled by three staged condensing units. It can provide cooling power ranging from 0 to 20kW depending on the CO2 temperature, with a flow rate of up to 2250 grams per second. The system is controlled by a PLC via touch screen or network and incorporates safety features like hazardous environment monitors. The text discusses the installation and commissioning phases, leak testing results, control system interface, and optimization strategies for effective cooling performance.

CMS CO2 Test Stand Specifications and Installation Status
E N D
Presentation Transcript
CMS CO2 Test Stand Specifications and Installation Status Erik Voirin Fermilab PPD - Process Engineering Group
CMS CO2 Cooling Plant Specs • Closed Loop System cooled by three staged condensing units. • Can provide 0 - 20kW of cooling depending on CO2 temperature. • Cooling Power: 0-8kW@-40C; 0-13kW@-30C; 0-20kW@-20C. • Carbon Dioxide Flow: Variable speed pumping to 2250 grams/sec. • System contains 135kg of CO2 and is rated to 84 bar. • Numerous connection points for small or large scale CO2 cooling experiments. • Controlled by PLC through touch screen or network. • Equipped with hazardous environment / CO2 air level monitors and safety alarms. • Status: In final installation and commissioning phase.
Installation / Commissioning Status • Mechanical installation complete, except for some pipe insulation • PLC and all instruments installed & commissioned • 3 Condensing units now being charged with R404a
Installation / Commissioning Status • Cross Shaped Storage Vessel in place and insulated with 4” Trymer insulation. • Storage Capacity is 625 Liters. • 135kg CO2 @ 35C
Installation / Commissioning Status • PLC Logic complete and touch screen controller programmed • All hardware (heaters, pump, chillers, valve, fan) are controlled by the PLC • Must complete insulation fill system with CO2 tune controls and test system under load.
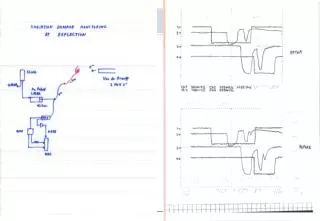
Pressure/Leak Testing • Thread sealants rated to 10,000 psi fail at 1200 psi. • (Teflon tape and Pipe Dope compounds) • System was completely leak tight at 300 psi. • Raised pressure to 1320 for pressure test, (Passed) • Bubble test at 1200 psi showed every single NPT fitting leaked. • Used 3M Scotch-Weld Structural Adhesive • 3M Pt#1838 Green • All No Leaks except for all three of the largest fittings (1.25” NPT) • Cleaned threads with alcohol, applied the adhesive to both male and female threads, retighten. • 4 day high pressure leak test at 950 psi showed no leaks and no drop in pressure.
Control System Interface – Main Overview • Touch screen and remote control and monitoring
Control System– Temperature Control • Set Storage Tank CO2 Temperature
Control System– Pump Control • Set differential pressure across experiment
FPIX Calculations and Characteristics of Single and Two Phase Flow Erik Voirin Fermilab PPD - Process Engineering Group
Pressure along routes of half diskStarting sub-cooled at 23.5 bar and -20C
Temperatures along routes of half diskStarting sub-cooled at 23.5 bar and -20C
Temperatures along routes of half diskStarting sub-cooled at 23.5 bar and -20C
Temperatures along routes of half diskStarting sub-cooled at 23.5 bar and -20C
Vapor Quality • Exit Quality is roughly 1% • Saturation doesn’t begin until partway into the half disk • High flow rate still yields a high convection coefficient in single phase flow (~16 kW/m2*K) • Results in a maximum bulk CO2 to tube wall temperature difference of 0.8C, 1.4C, 0.9C on Outer-Outer, Outer-Inner, and Inner tubes. (130% load)
Preheating to Saturation • Not recommended as a sole solution to achieve saturation, as it causes a sharp rise in fluid temperature, resulting in reduced performance.
Sub-cooled boiling • Wall boiling can occur before bulk fluid reaches saturation • Two phase correlations for heat transfer shouldn’t be used at the ~1% quality which could be seen in FPix • Second Putenkov equation gives most accurate results for these micro channel tubes with near single phase flow.
Lowering Temperature • Preheating to achieve saturation results in larger peak in temperature. • Adding a needle valve before flow enters the cooling tubes will reduce the pressure and temperature. It will also raise the quality and decrease the flow rate. • This would lower the temperature peak seen in the graph and move it to the left since we come closer to saturation by reducing pressure, not increasing temperature. • Could be dialed in upon commissioning. • For lowest temperature the lowest pressure difference from the detector outlet back to the storage tank is preferred. (NO OUTLET RESTRICTIONS)
Needle Valve/Pre-Heater Optimization • Attempting to calculate an optimal cooling scenario can only get us close to a possible solution. (Actual heat loads are not uniform and involve gravitational and momentum effects) • The pressure reducing valve assures we can tune our cooling tubes to get the absolute maximum possible performance with our given inlet and outlet conditions. • Can be combined with a pre-heater if needed. • This will allow us to tune the system to run at any differential pressure, any differential temperature, any flow rate, and any quality possible with our given inlet and outlet conditions.