Download
1 / 14
140 likes | 268 Views
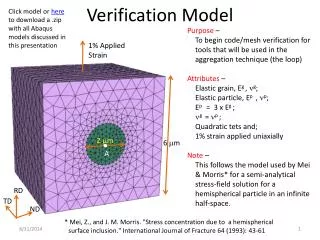
Univ of AZ WRF Model Verification. Method. NCEP Stage IV data used for precipitation verification Stage IV is composite of rain fall observations and radar estimates Data has a resolution of 4km http://www.emc.ncep.noaa.gov/mmb/ylin/pcpanl/stage4/

E N D
Method • NCEP Stage IV data used for precipitation verification • Stage IV is composite of rain fall observations and radar estimates • Data has a resolution of 4km • http://www.emc.ncep.noaa.gov/mmb/ylin/pcpanl/stage4/ • Nearest neighbor is used to move stage iv data to model data to observation site • Verification was performed on 12 hour accumulations at various forecast hours • For the 24 hr model forecast, verified the amount of precipitation accumulated for the 12 hr period ending at the time the 24 hour forecast is valid (i.e. for a 24 hr fcst from a 15 Nov 00Z model run, verify the precipitation that fell during the period 15 Nov 12Z – 16 Nov 00Z • Statistics generated for several precipitation thresholds: >1mm, >6.25mm(.25in), >12.5mm(.5in),>25mm(1in)
Nov 25 12Z Model RunWRF 5.4 km • On the following displays, the solid color is the model forecast • Dots and other symbols are the Stage IV precipitation observations • The color and shape of observations symbols represent the amount of precipitation accumulated in a 12 hour period ending at the forecast valid time • Statistics calculated for data displayed in the image
Model Run: 20081125 12Z Forecast: 18hr Accumulation Period: 20081125 18Z – 20081126 06Z Model Run: 20081125 12Z Forecast: 24hr Accumulation Period: 20081126 00Z – 20081126 12Z
Model Run: 20081125 12Z Forecast: 30hr Accumulation Period: 20081126 06Z – 20081126 18Z Model Run: 20081125 12Z Forecast: 36hr Accumulation Period: 20081126 12Z – 20081127 00Z
Model Run: 20081125 12Z Forecast: 42hr Accumulation Period: 20081126 18Z – 20081127 06Z Model Run: 20081125 12Z Forecast: 48hr Accumulation Period: 20081127 00Z – 20081127 12Z
Model Run: 20081125 12Z Forecast: 18hr Accumulation Period: 20081125 18Z – 20081126 06Z Model Run: 20081125 12Z Forecast: 24hr Accumulation Period: 20081126 00Z – 20081126 12Z
Model Run: 20081125 12Z Forecast: 30hr Accumulation Period: 20081125 06Z – 20081126 18Z Model Run: 20081125 12Z Forecast: 36hr Accumulation Period: 20081126 12Z – 20081127 00Z
Model Run: 20081125 12Z Forecast: 42hr Accumulation Period: 20081126 18Z – 20081127 06Z
Domain Verification • Period of verification is from 15 Oct – 28 Nov 2008 • During this period there were two major precipitation events over the area of interest • Not sure why the 30hr forecast shows higher skill compared to other forecasts • Probably due to the limited number of forecasts with precipitation for period