Download
1 / 55
550 likes | 691 Views
David Saÿen CMS Regional Administrator April 22, 2010. Medicare Purchasing Reform. Overview. Why value-based purchasing? What demonstrations are underway? Hospital demonstrations Physician demonstrations Other Lessons learned What demonstrations are planned?.

E N D
David Saÿen CMS Regional Administrator April 22, 2010 Medicare Purchasing Reform
Overview • Why value-based purchasing? • What demonstrations are underway? • Hospital demonstrations • Physician demonstrations • Other • Lessons learned • What demonstrations are planned?
Value-Based Purchasing Drivers • Focus on improving quality & efficiency • Growing calls for rewarding performance, demanding value for the dollars Medicare spends • Lower costs without reducing quality? • Better outcomes at same costs? • Challenges • Diverse & unique needs of 44 million beneficiaries • Fragmented delivery system: 700,000 physicians, 5,000 hospitals, etc.
Value-Driven Demonstrations • Hospital quality incentives • Physician pay-for-performance • ESRD disease management • Home health pay-for-performance • Gainsharing • Acute care episode • Electronic health records • Nursing home value-based purchasing
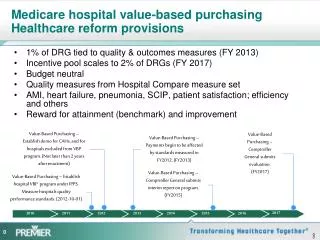
Hospital Quality Incentive Demonstration (HQID) • Partnership with Premier, Inc. • Uses financial incentives to encourage hospitals to provide high quality inpatient care • Test the impact of quality incentives • ~250 hospitals in 36 states • Implemented October 2003 • Phase II, 2006-2009
HQID Goals • Test hypothesis that quality-based incentives would raise the entire distribution of hospitals’ performance on selected quality metrics • Evaluate the impact of incentives on quality (process and outcomes) and cost
HQID Hospital Scoring • Hospitals scored on quality measures related to 5 conditions (36 measures and 21 test measures in year 4) • Roll-up individual measures into overall score for each condition • Categorized into deciles by condition to determine top performers • Incentives paid separately for each condition
Clinical Areas • Heart Failure • Community Acquired Pneumonia • AMI • Heart Bypass • Hip and Knee Replacement
Demonstration Phase II Policies • Incentives if exceed baseline mean • Two years earlier • 40% of $$ • Pay for highest 20% attainment • No difference between deciles • 30% of $$ • Pay for 20% highest improvement • Must also exceed baseline mean • 30% of $$
HQID Years 1 thru 4 • Quality scored improved by an average of 17% over 4-year period • Incentive payments averaged $8.2 million to ~120 hospitals in each of years 1-3 • Incentive payments of $12 million were spread across 225 hospitals in year 4
HQID Value Added • Demo “proof of concept” useful in development of proposal for national value-based purchasing program • Demo hospitals improved care, reduced morbidity and mortality for thousands of patients
Physician Group Practice (PGP) Demonstration 10 physician groups (200 physicians) ~ 5,000 physicians ~ 225,000 Medicare fee-for-service beneficiaries April 2005 implementation (now in 5th year)
PGP Goals & Objectives Encourage coordination of Medicare Part A & Part B services Reward physicians for improving quality and outcomes Promote efficiency Identify interventions that yielded improved outcomes and savings
PGP Design Maintain FFS payments Give physician practices broad flexibility to redesign care processes to achieve specified outcomes Performance on 32 quality measures Lower spending growth than local market Performance payments derived from savings (shared between Medicare and practices)
Medicare Shares Savings Assigned beneficiary total Medicare spending is > 2 percentage points below local market growth rate Share 80% of savings Allocated for cost efficiency & quality Maximum payment is 5% of Medicare Part A & B target
Process & Outcome Measures Claims-based Measure in Italics
PGP Quality—Year 3All 10 groups improved quality relative to base year on 28 of 32 measures
PGP Value Added Inform agency policy on key issues related to measurement of cost and quality Develop operational models for collecting physician practice data on quality and efficiency that can be applied to program-wide initiatives (e.g., Physician Quality Reporting Initiative) Template for accountable care organizations
Medicare Care Management Performance Demonstration • MMA section 649 • Pay for performance for MDs who: • Achieve quality benchmarks for chronically ill Medicare beneficiaries • Adopt and implement CCHIT-certified EHRs and report quality measures electronically • Budget neutral
MCMP Goals • Improve quality and coordination of care for chronically ill Medicare FFS beneficiaries • Promote adoption and use of information technology by small-medium sized physician practices
Potential MCMP Payments • Initial “pay for reporting” incentive • Up to $1,000/physician, $5,000 practice • Annual “pay for performance” incentive • Up to $10,000/physician, $50,000 practice per year • Annual bonus for electronic reporting • Up to 25% of clinical “pay for performance” payment tied to # measures reported electronically • Practice must be eligible for quality bonus first • Up to $2,500 per physician, $12,500/practice per year • Maximum potential payment over 3 years • $38,500 per physician; $192,500 per practice
MCMP Early Results • Baseline P4P payments: • Total payments: $1.5 million • 88% of practices received max incentive for baseline • First P4P payments: • 560 practices out of 610 participating practices received performance payments • Total: $7.5 million
MCMP Early Results Operational and implementation issues Smaller practices have limited resources Staff, time Smaller practices may have limited IT experience Significant support needed
MCMP Value Added • Establishes foundation for accelerated implementation of EHR demonstration • Use lessons from MCMP to shape value-based initiatives for physician services under Medicare (e.g., PQRI, EHR)
Lessons Learned • Value-based purchasing can work: it provides a framework for an organizational focus on quality • Potential spillover to overall quality, not just “teach to the test” • Jury still out re: public reporting alone, savings, unintended consequences
Lessons Learned: Financial Incentives Modest financial incentives can be adequate to change behavior, yield sustained improvement over time Measurement of savings is highly sensitive to target setting methodology, risk adjustment of beneficiary population, size of demo population Generating savings or reducing expenditure growth is difficult
Lessons Learned:Quality Measures • Determining quality measures is difficult and requires much development • Clearly defined goals, measure specifications and reporting methodology • Consistent with clinical practice and high quality care—physician/provider buy-in • Easier to measure underuse (gaps in care) than overuse (unnecessary, duplicative, futile)
Lessons Learned: Quality Measures • Changing measures frequently creates provider angst • Processes more readily moved than outcomes • Ceiling effect may render some measures obsolete • Effect potential continued improvement by shift to person-level measurement (appropriate-care model)
Lessons Learned: Quality Reporting Increases awareness and documentation of care processes Outreach and education are important for provider understanding and accurate and consistent reporting Measuring/reporting quality creates opportunity for providers to standardize care processes and redesign workflows to improve delivery at point of care
Lessons Learned:Organizational Participation • Leadership, organizational champions and dedicated resources are critical • Providers volunteer to gain experience with initiatives consistent with their strategic visions and market objectives • Wide distribution of incentives (improvement and attainment) may help maintain interest and support • Administrative, clinical, data (EHR) and financial integration appears necessary (but not sufficient) to produce savings
Home Health Pay-for-Performance Demonstration • Objective: Test whether performance-based incentives can improve quality and reduce program costs of Medicare home health beneficiaries. Two year demonstration, ended on Dec. 31, 2009. • ~ 600 home health agencies in 4 regions randomized into intervention and control groups • Northeast: Connecticut, Massachusetts • Midwest: Illinois • South: Alabama, Georgia, Tennessee • West: California
Home Health Pay-for-Performance Demonstration • 7 quality measures (Acute care hospitalization, Emergent care, Bathing, Ambulation/Locomotion, Transferring, Management of oral medications, Status of surgical wounds) • Performance scored and incentives paid to HHAs for each measure separately • HHAs w/ top 20% of performance scores • HHAs w/ top 20% of improvement gains
Gainsharing Overview • Means to align incentives between hospitals and physicians • Hospitals pay physicians a share of savings that result from collaborative efforts between the hospital and the physician to improve quality and efficiency • Requires waiver of civil money penalties
Two Gainsharing Demonstrations • DRA Sec. 5007: Medicare Hospital Gainsharing Demonstration • 2 hospitals • October 2008 implementation (ends Dec. 2009) • MMA Sec. 646: Physician Hospital Collaboration Demonstration • Consortium of 12 New Jersey hospitals • July 2009 implementation
Demonstration Goals • Improve quality and efficiency of care • Encourage physician-hospital collaboration by permitting hospitals to share internal savings • CMS open to wide variety of models; projects must be budget neutral
Gainsharing Payments No change in Medicare payments to gainsharing hospitals Must represent share of internal hospital savings and be tied to quality improvement No payments for referrals Limited to 25% of physician fees for care of patients affected by quality improvement activity
Gainsharing Payments Gainsharing must be a transparent arrangement that clearly identifies the actions that are expected to result in cost savings Incentives must be reviewable, auditable, and implemented uniformly across physicians Payments must be linked to quality and efficiency
Possible Approaches • Reduced time to diagnosis • Improved scheduling of OR, ICU • Reduced duplicate or marginal tests • Reduced drug interactions, adverse events • Improved discharge planning and care coordination • Reduced surgical infections and complications • Reduced cost of devices and supplies
Acute Care Episode (ACE) Demonstration Tests a discounted global payment for acute care hospital stay and corresponding physician services Includes 28 cardiovascular and 9 orthopedic MS-DRGs Covers Medicare fee-for-service admissions at selected sites Will use 22 quality measures to monitor the program
Demonstration Goals Improve quality of care through consumer and provider understanding of both price and quality information Increase provider collaboration Reduce Medicare payments for acute care services using market mechanisms Build platform for potential expansions— geography, additional MS-DRGs, post-acute care
Demonstration Benefits • Medicare – 1-6 percent discount depending upon the site • Providers – gainsharing and potential for increased patient volume • Beneficiaries – shared savings payments based upon 50 percent of Medicare savings • Potential model • Expanded use of bundling • Quality-driven patient decision-making
Demonstration Sites • 3-year demonstration began May 2009 • Initiated in one MAC service area: TX, NM, OK, and CO • Hospitals known as Value-Based Care Centers • Hillcrest Medical Center – Tulsa • Baptist Health System – San Antonio • Lovelace Health System – Albuquerque • Oklahoma Heart Hospital – Oklahoma City • Exempla Saint Joseph Hospital – Denver
Electronic Health Records • Former Secretary’s initiative • Goal is to support former President Bush’s Executive Order and encourage adoption of EHRs by small physician practices • Opportunity to inform “meaningful use” definition for ARRA funds • Opportunity for private payers to align with model
Electronic Health Records • 5-year demonstration began June 1, 2009 • ~800 practices in 4 states (randomized into intervention and control groups) • Modeled on MCMP Demonstration and platforms • Base payment for performance on 26 quality measures • Bonus for use of CCHIT-certified EHRs with higher payment for greater functionality
Nursing Home Value-Based Purchasing Demonstration Objective: Improve quality of care for all Medicare beneficiaries in nursing homes (short-stay or long-stay) Performance payments based on nursing home quality of care in 4 domains: Nurse staffing levels Hospitalization rates MDS outcomes Survey deficiencies