Download
1 / 25
250 likes | 340 Views
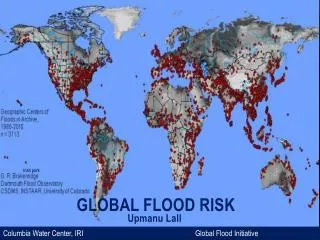
Global Flood and Drought Prediction. GEWEX 2005 Meeting, June 20-24 Role of Modeling in Predictability and Prediction Studies Nathalie Voisin, Dennis P. Lettenmaier, Eric F. Wood. Global Floods and Droughts. Floods $50-60 billion USD /year, worldwide

E N D
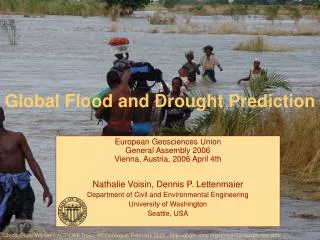
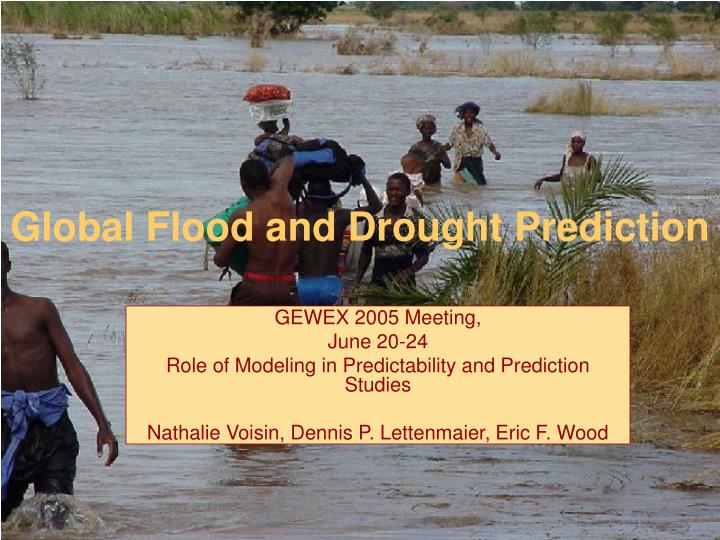
Global Flood and Drought Prediction GEWEX 2005 Meeting, June 20-24 Role of Modeling in Predictability and Prediction Studies Nathalie Voisin, Dennis P. Lettenmaier, Eric F. Wood
Global Floods and Droughts • Floods • $50-60 billion USD /year, worldwide • 520+ million people impacted per year worldwide • Estimates of up to 25,000 annual deaths Mostly in developing countries; Mozambique in 2000 and 2001, Vietnam and others (Mekong) in 2000. • Droughts • 1988 US Drought: $40 billion • Famine in many countries: 200,000 people killed in Ethiopiain 1973-74 Source: United Nations University, http://update.unu.edu/archive/issue32_2.htm http://www.unu.edu/env/govern/ElNIno/CountryReports/inside/ethopia/Executive%20Summary/Executive%20Summary-txt.html 1988 drought: NCDC : http://lwf.ncdc.noaa.gov/oa/reports/billionz.html
New technologies In the last 25 years: • Climate models • Hydrological models • Land surface schemes • Remote sensing devices • Archives, storage Despite all these advances, no capability for performing global hydrological prediction
But discontinuity on a global scale… • Uneven observations • local hydrological models Hydrologic warnings tend to be localized
Objectives Develop a global flood and drought nowcast and prediction system Using • climate ensemble forecasts • Distributed hydrologic model VIC ( U. of Washington, Princeton University) • Satellite remote sensing information • NCEP / ECMWF data sets
INITIAL STATE Forecast System Schematic * soil moisture snowpack streamflow, soil moisture, snow water equivalent, runoff local scale (1/2 degree) weather inputs Hydrologic forecast simulation Hydrologic model spin up ensemble forecasts NCEP GSM ensemble Satellite precipitation estimates G-LDAS /other real-time met. forcings for spin-up AMSR-E MODIS Update SNOTELUpdate NOWCASTS SEASONAL FORECASTS (drought) 1-2 years back Month 0 SHORT TERM FORECASTS (flood) * Similar experimental procedure as used by Wood et al (2005) West-wide seasonal hydrologic forecast system
Hydrologic Model Spin Up Preliminary studies • Compare Hydrological variables as simulated by the distributed model VIC using • Climatology: Adam and Lettenmaier (2003) and Adam et al (2005) precipitation data sets • gauge undercatch and orography correction • 1979-1999 • Refer to A & al. later on • Satellite precipitation estimates
Satellite datasets Choosing satellite data sets • Availability ( near real time later on) • Time resolution (daily and less) • Spatial resolution ( ½ lat/lon degree maximum) • Spatial coverage (global)
Satellite precipitation estimates Surrogate for future near real time satellite estimates: GPCP 1DD daily precipitation • Huffman et al 2001 • Infra-Red (TMPI) over 40oS-40oN • Recalibrated TIROS Operational Vertical Sounder (TOVS) beyond 40oS and 40oN • Scaled to match monthly GPCP Version 2 Satellite-Gauge precipitation estimates • 1997-present
Major Basins to be simulated first Danube Mackenzie Mississippi Mekong 6 simulated basins Study basins Congo World Basins Amazon
1997-99 Water Balance (mm) • We compare hydrologic variables as simulated by VIC driven • by 1997-99: • A & al.precipitation estimates • GPCP 1DD (Huffman et al 2001) precipitation estimates
Future work • Model Spin up • Further analysis : assess bias in simulated hydrologic variables when using satellite precipitation estimates • Extend A & al data sets to 2004 • Use CMORPH (Joyce et al 2004) • Use other precipitation estimates: • NCEP • ECMWF ERA 40 • Bias adjustment of forcing data set : need 10 years of observations at least
Future Work • Data Assimilation: • use satellite soil moisture • still experimental, • need further validation and assess the additional skill in forecast • Use MODIS: experimental as well • Forecasts: • Validation with retrospective forecasts, near real time forecasts / nowcasts • Assess predictability skills ; • initial conditions • precipitation forecast
Thank You! Credit: Philip Wijmans/ACT-LWF Trevo, Mozambique, February 2000 , http://gbgm-umc.org/umcor/00/mozphotos.stm