Download
1 / 41
410 likes | 500 Views
Learn how ecosystem health is determined by factors like biotic integrity and resilience. Explore techniques for assessing watershed health, such as physical habitat assessments and water chemistry evaluations. Discover the importance of ecosystem indicators and ecosystem-level measurements using indexes of biotic integrity and macroinvertebrate assessments. Uncover the ecological effects of development in the Wappingers and Fishkill watersheds through land use patterns, environmental quality, and biological indicators. Gain insights into future development projections and their impact on watershed health.

E N D
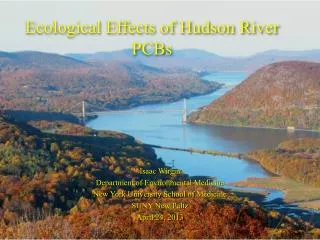
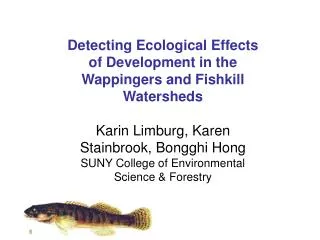
Detecting Ecological Effects of Development in the Wappingers and Fishkill Watersheds Karin Limburg, Karen Stainbrook, Bongghi Hong SUNY College of Environmental Science & Forestry
Ecosystem health, qu’est-ce que c’est? - a concept that’s been around a long time, currently enjoying a comeback • maintenance of “biotic integrity” • resistance and/or resilience of systems in the face of disturbance • absence of factors that degrade ecological population, community, and ecosystem structure and function
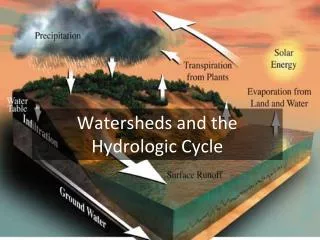
Assessing watershed health: The idea: organisms and ecosystems integrate and reflect the insults (or lack thereof) resulting from watershed-level processes Some techniques have proven robust after 25+ years of testing; others in development
Ecosystem indicators of human disturbance should ideally be sensitive to these factors, and not confounded by natural ones (or at least possible to tease out the differences) Metric B Metric A Low Human influence High
Indicators of ecosystem health can (should?) evaluate changes at levels of • Population • Community/habitat • Whole-system Metrics may not all be additive, although many schemes designed that way
What we looked at: • physical habitat characterizations • water chemistry • biotic community structure (fish and bugs) • ecosystem function Total of 33 sites
tributary mainstem
Physical habitat – involved making many measurements of flow, stream dimensions, substrate types, vegetative cover, bank characteristics, riparian zone, etc
Water chemistry: four synoptic surveys conducted May - August – get high and low flow conditions The idea: to characterize the nutrient environment that indicates whether or nor an ecosystem will be eutrophic or just “well balanced” (very few, if any, sites here expected to be oligotrophic…)
Water chemistry parameters we measured: • Dissolved O2, pH, temperature, conductivity in the field • Chlorophyll, TSS, particulate C & N, total N & P, NO3, NH4, TDN, SRP, TDP, DSi, DOC, TDS in the lab
Indexes of biotic integrity (IBI): collected fish by electrofishing 100 m of stream – Noted species, abundances, lengths & weights, obvious diseases, etc.
Macroinvertebrate (stream insect) IBIs: collected 3 representative kick-samples, identified insects to lowest “reasonable” taxonomic unit
Ecosystem-level measurements: Community metabolism Food web linkages
Some results: how “healthy” are the Wappingers and Fishkill Creek watersheds? Let’s look at a few diagnostics… Land use patterns Environmental quality patterns Biological indicators …includes changes over time
Assessments at different spatial scales (relates to the degree of influence)
Amount of land in different uses varied at different spatial scales Percent
Conductivity – a measure of the ionic strength of water Correlates strongly with human disturbance (population density, road density, nitrates, etc.) Getting recognition as a bellwether of aquatic disturbance
”overbuilt” ”under-built”
Last bits: some time trends. • Land use change, 1992 vs. 2001 • Changes in Fishkill biotic indexes • Some projections about % impervious surfaces (from models)
Comparing bio-indicator scores in Fishkill: across the board improvement since 1988!
Percent impervious surface: Current conditions in Wappingers watershed
A simulated look at the future, with new housing generated, but classified as “low intensity” (i.e., with relatively low percent impervious surface)
Simulated future, with new housing, but with it classified as “high intensity” Lots more impervious surface
Summary: how is the “health” of the two watersheds? • Land use cover: similar at large scale, but Fishkill seems more developed near the sites of stream studies • Stream quality indicators: Fishkill worse off • Biological indicators: Fishkill worse off • Yet, Fishkill in 2001 has better bio-scores than in 1988
Finally, future development will likely increase things like impervious surfaces and thus increase stream degradation
Thank you! Funded by Hudson River Foundation and National Science Foundation