Download
1 / 10
100 likes | 109 Views
HCA, located in 16 of the fastest growing US cities, has a significant market share and facilities in Texas, Florida, Denver, and more. The healthcare market outlook is strong with national healthcare spending projected to increase. HCA has shown strong cash flow trends and has opportunities for growth through expansion and capital expenditures. The company also has a prudent financial strategy that includes share repurchase and dividends for shareholders.

E N D
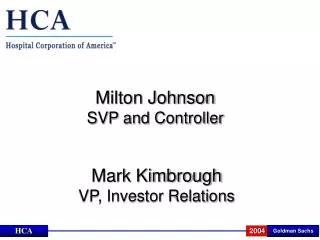
Vic Campbell Senior Vice President Milton Johnson SVP and Controller Mark Kimbrough VP, Investor Relations Banc of America – May 2004
% % % % HCA is located in 16 of 20 Fastest Growing Large US Cities Dallas/Ft. Worth +12% • Generally 25-40% Market Share • 40% of facilities in Texas & Florida Denver +9% Kansas City +5% U.K. Las Vegas +22% Nashville +8% Switzerland Richmond +8% Austin +18% Southern California +9% Panhandle +10% % % Palm Beach +11% Percent Growth in Market Population 2000-2005 Tampa Bay +8% Houston +10% Dade +8% Compared to the National Average of 4.5%
Health Care Market Outlook Strong National Health Care Spending 1990 – 2010 U.S. Healthcare Expenditures ($ Billions) 12.0% 13.4% 13.3% 14.8% 15.4% 15.9% 16.4% 17.1% National Health Care Expenditures as a Share of Total GDP Will the U.S. economy shift 2.3% of GDP to health care services over the next seven years? Source: U.S. Centers for Medicare and Medicaid Services—National Health Expenditure Projections, 2003
Inpatient Admissions and Outpatient Visits 1980 - 2002 Inpatient Admissions Outpatient Visits (millions) Admissions (millions) Outpatient Visits Source: AHA Annual Survey, 1980 - 2002
HCA Admission Trends 2001 to 1Q 2004Same Facility 15.4% HCA Growing Medicare Market Share Growth in Medicare Admissions 1998-2001 Market Competitors HCA
Strong Cash Flow Trends Provide Opportunities Net Cash Provided by Operating Activities Dollars in Millions Capital Reinvestment Balance Sheet Share Repurchase Program New Dividend Policy Excluding settlements with government agencies and investigation related costs.
2001 $1.4 2000 $1.2 2002 $1.7 2003 $1.8 2004E $1.8 37 ER Expansions 37 ER Expansions Open Heart, Imaging Cardiology, Oncology, etc. 54 Facilities with Surgery and/or ICU/CCU expansions Four New Facilities 378 Beds 1,565 New Beds HCA Capital Expenditures Billions Infra- structure Patient Safety New Hospitals Expansions New Denver Facility Routine Distribution of Capital Dollars 2002-2005 and Beyond
650M Shares 12/31/96 465M Shares2 4/30/04 Opportunities Of Having Strong Cash Flow Share repurchase program $42.19/share $35.76/share YTD 20041 $7.3 Billion 244 Million Shares 38% of outstanding shares Average Price: $30.03 $422M: 10.0M Shares $45.53/share 2003 $1.1B: 31.1M Shares 2002 $36.88/share $282M: 6.2M Shares $706M: 19.2M Shares 2001 $28.65/share 2000 $1.3B: 43.5M Shares $24.61/share $1.4B: 55.6M Shares 1999 $22.68/share $930M: 41M Shares 1998 $33.59/share 1997 $1.3B: 37.9M Shares 1: 2004 purchases through 5-6-04 2: Includes other activities affecting share balance (stock option exercises, restricted grants, and ESPP activity).
The Genesis of the Bad Debt/Charity Care Issue HCA is in 14 of the 20 highest uninsured states, with 72% of its hospitals in those states 17.0% 13.1% 13.1% 22.2% 21.2% 15.9% National Average: 15.2% 1 19.3% 19.2% 18.1% 15.1% 15.4% 15.4% 16.4% 23.5% 20.3% 14.6% 23.5% HCA Weighted Average: 22.6% 2 16.7% 19.7% 29.7% 25.6% 22.8% 22.2% >20% Uninsured 15-20% Uninsured <15% Uninsured 1: U.S. Census Bureau “Health Insurance Coverage in the United States: 2002”. 2: Kaiser Commission: Health Ins. Coverage of Nonelderly Adults 2001-2002.
In Summary We Have…. Great Assets Excellent Investment Opportunities Strong Cash Flows Excellent Long-Term Earnings Growth Outlook A prudent financial strategy that provides for a strong balance sheet and return of cash to shareholders through share repurchase and/or dividends