Download
1 / 45
470 likes | 642 Views
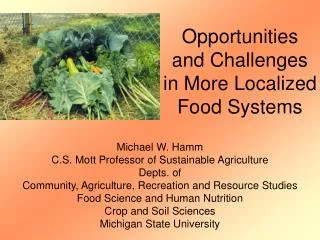
Opportunities and Challenges in More Localized Food Systems. Michael W. Hamm C.S. Mott Professor of Sustainable Agriculture Depts. of Community, Agriculture, Recreation and Resource Studies Food Science and Human Nutrition Crop and Soil Sciences Michigan State University.

E N D
Opportunities and Challenges in More Localized Food Systems Michael W. Hamm C.S. Mott Professor of Sustainable Agriculture Depts. of Community, Agriculture, Recreation and Resource Studies Food Science and Human Nutrition Crop and Soil Sciences Michigan State University
Why is Sustainability an Important Central Tenet for Our Work?
1300 miles Easter Island A Cautionary Tale • Key Facts • Recent volcanic island so fertile soils • 27 degrees south- overly cool for many things like coconuts to do well and water overly cool for coral reefs and associated fish abundance (about same south as Houston, TX is north) Map from: http://www.mapsouthpacific.com/pacific/index.html Picture from: http://members.virtualtourist.com/m/7cbc2/946/
Food Supply and Ecology • At time of discovery (Early 1700’s ) • Sweet potatoes, yams taro, bananas, sugarcane, chickens • 66 square miles of grassland with no trees or bushes above 10 ft. • No native animals larger than insects • When early Polynesians first arrived • The island was forested with diverse understory • Trees were species that could provide rope material, dense firewood and boat making materials • 1/3 of all bones were from porpoises • Bones of six bird species with at least 25 nesting species altogether
Chain of Events Wood gets cut Can’t make many canoes Can’t go out to hunt porpoises Find more chicken bones
Chain of Events Wood gets cut Soil more erodable Crop productivity declines
Social Consequences Starvation Population Crash Cannibalism War and Statue Defamation
American Farmland Trust http://www.farmland.org/farmingontheedge/downloads.htm
The Three Challenges:number 1 – Farmer Loss From: Public Sector Associates: Michigan Land Resources Project (2001)
No Data <10% 10%–14% 15%–19% 20%–24% 25%–29% ≥30% Obesity Trends* Among U.S. AdultsBRFSS, 1985 (*BMI ≥30, or ~ 30 lbs overweight for 5’ 4” person) From: Overweight and Obesity: Obesity Trends: U.S. Obesity Trends 1985–2005 (downloaded from: http://www.cdc.gov/nccdphp/dnpa/obesity/trend/maps/index.htm
No Data <10% 10%–14% 15%–19% 20%–24% 25%–29% ≥30% Obesity Trends* Among U.S. AdultsBRFSS, 2005 (*BMI ≥30, or ~ 30 lbs overweight for 5’ 4” person) From: Overweight and Obesity: Obesity Trends: U.S. Obesity Trends 1985–2005 (downloaded from: http://www.cdc.gov/nccdphp/dnpa/obesity/trend/maps/index.htm
The Three Challenges:number 3 – Job Loss • 98.4% of the 211,567 businesses in MI are classified as small • MI lost over 2,000 businesses between 2000 – 2002 • MI 37th in the country in terms of firm formation for 2002 • i.e. lots of opportunity and need
Growth and Development Growth = an increase in size through material accretion Development = realization of fuller and greater potential Is the Land Grant role at this point primarily one of growth or development?
The Land Grant Role Help provide a context for decision making about alternatives and options
Community Development Value-Chain Networks Place-Based Development Attribute-driven Production A Framework
A Strategy A diversity of viable farms Farming People maintaining a quality standard of life as they mature and age Health Economics Vibrant rural and urban communities Environment Our natural resource base enhanced for future generations Picture from SUSTAINABLE POULTRY: PRODUCTION OVERVIEW at http://www.attra.org/attra-pub/PDF/poultryoverview.pdf
Food Attributes Consumers Are Willing to Pay for in the Marketplace • Place (Local - e.g. Select Michigan) • Organic • Scale (e.g. small family farm) • Environmental (e.g. low pesticide use, bird friendly) • Animal friendly/animal welfare • Heritage breed/variety • Labor standards and returns (e.g. fair trade)
Consumers • Hartman group divides into: • Core (13%) • Mid-level (62%) • Periphery (24%) • 10 years ago • Organic foods in the core • Today • Organic foods in the mid-level • Local, bio-dynamic, fair food in the core • Periphery moved to healthier such as “natural”
Consumers (cont.) • Some core consumers saying local more important • 50% of consumers said locally grown affected purchases • 38% of consumers said organic affected purchases
Consumption of Fruits and Vegetables 7% of population achieves 5-7-9 servings or more when french fries and potato chips are excluded Produce for Better Health Foundation “State of the Plate”
And on average imported have higher levels of pesticide residues than domestic in a • particular product category* Taken from http://www.fas.usda.gov/scriptsw/bico/bico.asp?Entry=lout&doc=1270 * C. Benbrook “ Minimizing Pesticide Dietary Exposure Through the Consumption of Organic Food: An Organic Center State of Science Review” (2004)
Approximately 78,000 acres of production What if Consumers in Michigan Ate 5 Servings of Fruits and Vegetables Per Day? Nearly 100 pounds of fruits and vegetables per adult more And now we are recommending 7 -9 servings a day
Maximum crop acreage adjustments implied by full adoption of selectrecommendations from the 2005 Dietary Guidelines for Americans J. C. Buzby, H. Farah Wells, and G. V. Possible Implications for U.S. Agriculture From Adoption of Select Dietary Guidelines (ERS Report #31, 2006)
Production Strategies Marionberries Strawberries conventional (gray bars), organic (white bars), or sustainable (black bars) agricultural practices Corn D. K. ASAMI, Y.-J. HONG, D. M. BARRETT, AND A. E. MITCHELL J. Agric. Food Chem. 2003, 51, 1237-1241
Variety Variation • E.g. Brown et al at Univ. of Illinois have found significant variation in phytochemical concentration due to genotype
Authors: Patty Cantrell David Conner George Erickcek Michael Hamm Download at: mottgroup.msu.edu or mlui.org
Economic Impacts • Up to 1,889 jobs • $187 million in new, personal income
Improved Diet • Iowa- 25% of current consumption of 37 fruits and vegetables shift to being grown in Iowa • Approx. 2300 net new jobs if all direct markets • Approx. 1200 net new jobs if 50% direct markets • Iowa- all Iowans consume 5 servings per day • Approx. 4000 net new jobs • Iowa- all Iowans consume 7 servings per day • Approx. 5600 net new jobs • D. Swenson (2006) The Economic Impacts of Increased Fruit and Vegetable Production • and Consumption in Iowa: Phase II (downloaded at http://www.leopold.iastate.edu/pubs/staff/health/health.htm)
Michigan Farmers’ Markets in relation to Urban Areas (2000) Socio-Ecological and Geographical Analysis of Michigan’s Agriculture: Toward a Policy and Planning Tool for Sustainable Agriculture in Michigan Jim Bingen, Manuel Colunga, and Stuart GageResource Development and Computational Ecology and Visualization Laboratory (Entomology Department)
Greenhouse and High Tunnel Production- Sustainably Expanding the Season and the Markets
Organic Market • $10 billion in 2003 • 2% of total grocery sales BUT growing 8 times faster than grocery sector as a whole • Projected $32.3 billion by 2009 • Will likely exceed 20% growth rate in future
Recent Growth Patterns in the U.S. Organic Foods Market. By C. Dimitri and C. Greene USDA-ERS
Recent Growth Patterns in the U.S. Organic Foods Market. By C. Dimitri and C. Greene USDA-ERS
Recent Growth Patterns in the U.S. Organic Foods Market. By C. Dimitri and C. Greene USDA-ERS
What does this mean for Michigan? • About $66 million of organic fruit and vegetable sales • About $22 million of organic bread and grain sales • About $15 million of organic milk sales
What might this mean for farmers? Recent Growth Patterns in the U.S. Organic Foods Market. By C. Dimitri and C. Greene USDA-ERS
Access for All Members of a Community Food Desserts Taken from K. Pothukuchi, The Detroit Food System (2003)
Household Expenditure for Fruits and Vegetables From: Bureau of Labor Statistics, Consumer Expenditure Survey http://www.bls.gov/cex/home.htm#top
New Farms – Seeding Economies E.g. 2 yr Organic Farming Program at MSU E.g. Land Link Program E.g. MIFMA Training Land Markets Capital Information Business Dev. E.g. MSUE RSA E.g. MSU Product Center E.g. IDA’s and Small Loan Program
The End mottgroup.msu.edumhamm@msu.edu