Download

1 / 35
450 likes | 1.26k Views
Nutrition Screening and Assessment in Critically ill patients. Rupinder Dhaliwal, RD Clinical Evaluation Research Unit Kingston General Hospital. Outline. incidence of underfeeding in the ICU nutritional screening tools available for use in ICU

E N D
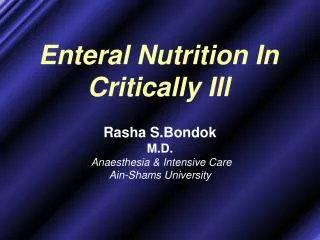
Nutrition Screening and Assessment in Critically ill patients Rupinder Dhaliwal, RD Clinical Evaluation Research Unit Kingston General Hospital
Outline incidence of underfeeding in the ICU • nutritional screening tools available for use in ICU • familiar with the novel approach used to assess the nutritional risk of critically ill patients and implications of this risk assessment for clinical practice
Does underfeeding in ICUs exist? Mean intake 56% International Nutrition Survey, n =211 ICUs
Purpose of Nutrition Screening Predict the probability of a better or worse outcome due to nutrition SCREENING Malnutrition goes undetected
Screening leads to Nutritional Care Hospitals & healthcare organizations should have a policy and a specific set of protocols for identifying patients at nutritional risk. The following process is suggested: • Screening • Assessment • Monitoring & Outcome • Communication • Audit Kondrup et al. Clin Nutr 22(4):415-421;2003.
Underfeeding does occur in ICUs • Malnutrition: 30% ICU patients (SGA) • Existing tools for nutrition screening
Malnutrition Universal Screening Tool (MUST) Nutritional Risk Screening (NRS 2002) Mini Nutritional Assessment (MNA) Short Nutritional Assessment Questionnaire (SNAQ) Malnutrition Screening Tool (MST) Subjective Global Assessment (SGA) Anthony NCP 2008
When training provided in advance, SGA can produce reliable estimates of malnutrition Note rates of missing data (7-34%)
n = 119, > 65 yrs, mostly medical patients, not all ICU • no difference between well-nourished and malnourished patients with regard to the serum protein values on admission, LOS, and mortality rate
n = 124, mostly surgical patients 100% data available for SGA SGA predicted mortality
Quantify Lean Muscle Mass: CT Scan • Body composition tools: • BIA, skin fold: low precision , DEXA: not specific, $$ • CTs becoming common research tool • Measures tissue mass and changes over time 50 geriatric trauma pts prevalence of sarcopenia (low muscularity) on admission =78% Despite the majority being overweight! M. Mourtzakis et al
ICU patients are not all created equal…should we expect the impact of nutrition therapy to be the same across all patients?
Malnutrition should be diagnosed on the basis of etiology…. inflammation acute vs chronic
In the ICU….. • Caloric debt/underfeeding • Malnutrition exists 34% or > • Historical nutrition data n/a • Not all patients equal • Consider • Inflammation • Acute diseases • Chronic diseases How do we figure out who will benefit the most from Nutrition Therapy?
A Conceptual Model for Nutrition Risk Assessment in the Critically ill • Acute • Reduced po intake • pre ICU hospital stay • Acute • IL-6 • CRP • PCT • Chronic • Recent weight loss • BMI? • Chronic • Comorbid illness Starvation Nutrition Status micronutrient levels - immune markers - muscle mass Inflammation
Objective Develop a score using the variables in the model to Quantify the risk of ICU pts developing adverse events that may be modified by nutrition
The Development of theNUTrition Risk in the Critically ill Score (NUTRIC Score) • When adjusting for age, APACHE II, and SOFA, what effect of nutritional risk factors on clinical outcomes? • Multi institutional data base of 598 patients (3 ICUs) • Historical po intake and weight loss only available in 171 patients • Outcome: 28 day vent-free days and mortality
What are the nutritional risk factors associated with mortality?(validation of our candidate variables)
What are the nutritional risk factors associated with Vent Free days?(validation of our candidate variables) BMI: no effect on Vent free days
The Development of the NUTrition Risk in the Critically ill Score (NUTRIC Score) • % oral intake in the week prior dichotomized into • patients who reported less than 100% • all other patients • Weight loss was dichotomized as • patients who reported any weight loss • all other patients • BMI was dichotomized as • <20 • all others • Comorbidities was left as integer values range 0-5
The Development of the NUTrition Risk in the Critically ill Score (NUTRIC Score) All other variables (Age, APACHE 2, SOFA, Comorbidities, LOS pre ICU, IL 6) were categorized into five equal sized groups (quintiles) Exact quintiles and logistic parameters for age • Logistic regression analyses • Each quintile compared to lowest risk • category • Rounded off to the nearest whole # to • provide points for the scoring system
The Development of the NUTrition Risk in the Critically ill Score (NUTRIC Score) BMI, CRP, PCT, weight loss, and oral intake were excluded because they were not significantly associated with mortality or their inclusion did not improve the fit of the final model.
The Validation of the NUTrition Risk in the Critically ill Score (NUTRIC Score) Statistical modeling higher score = higher mortality
The Validation of the NUTrition Risk in the Critically ill Score (NUTRIC Score) high score = longer ventilation
The Validation of the NUTrition Risk in the Critically ill Score (NUTRIC Score) Can NUTRIC score modify the association between nutritional adequacy and mortality? (n=211) Highest score pts, low nutrition is associated with higher mortality!! Lowest score pts, more nutrition may be associated with higher mortality ? P value for the interaction=0.01 P value for the interaction=0.01
Summarize: NUTRIC Score • NUTRIC Score (0-10) based on • Age • APACHE II • SOFA • # comorbidities • Days in hospital pre ICU • IL 6 • High NUTRIC Score associated worse outcomes (mortality, ventilation) • High NUTRIC Score benefit the most from nutrition • Low NUTRIC Score : harmful?
Applications of NUTRIC Score • Help determine which patients will benefit more from nutrition • Supplemental PN • Aggressive feeding • Small bowel feeding • Design & interpretation of future studies • Negative studies, non high risk, heterogenous patients
Limitations • Applies only to macronutrients • Does not apply to pharmaconutrients • Nutritional history is suboptimal • Requires IL-6
Conclusion • Iatrogenic underfeeding in ICUs exist • Nutrition Screening/audits* detect underfeeding • Existing Screening tools not helpful in ICU • Not all ICU patients are the same in terms of ‘risk’ • NUTRIC Score is one way to quantify that risk and can be used in your ICU • Further refinement of this tool will ensure that the right patient gets nutrition
Thanks Dr. Daren Heyland Xuran Jiang Andrew Day