Download
1 / 68
690 likes | 852 Views
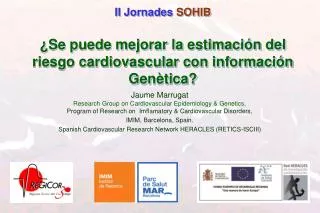
II Jornades SOHIB ¿Se puede mejorar la estimación del riesgo cardiovascular con información Genètica?. Jaume Marrugat Research Group on Cardiovascular Epidemiology & Genetics, Program of Research on Imflamatory & Cardiovascular Disorders, IMIM, Barcelona, Spain.

E N D
II Jornades SOHIB¿Se puede mejorar la estimación del riesgo cardiovascular con información Genètica? Jaume MarrugatResearch Group on Cardiovascular Epidemiology & Genetics,Program of Research on Imflamatory & Cardiovascular Disorders, IMIM, Barcelona, Spain. Spanish Cardiovascular Research Network HERACLES (RETICS-ISCIII)
Justification of primary prevention of coronary heart disease • Greatest cause of death in developed countries. In ~35% of cases its onset symptom is sudden death. • Most cases are related to lifestyle & other modifiable factors, whose improvement results in reduced CHD incidence.
Cumulative incidence of CVD adjusted for the competing risk of death for men and women according to aggregate risk factor burden at 50 years of age, in the Framingham Heart Study 0,7 0,6 0,5 0,4 0,3 0,2 0,1 0 Men Women 50 60 70 80 90 50 60 70 80 90 ≥ 2 risk factors 1 major risk factor ≥ 1 increased risk factor ≥ 1 suboptimal risk factor All risk factors optimal 69% 50% 50% 46% Adjusted Cumulated Incidence 36% 39% 8% <3% a Framingham i 10% a Girona 5% Attained age Lloyd Jones.Circulation. 2006;791-798
Changes in population LDL & HDL cholesterol 1995-2005 Girona population aged 35-74 years Grau M & REGICOR Inv. Eur J Cardiovasc Prev Rehabil. 2007. 14: 653-9.
Cambios en la prevalencia de hipertensión arterial 1995-2005Población de Girona de 35-74 años Hombres Mujeres Grau M & REGICOR Inv. Eur J Cardiovasc Prev Rehabil. 2007. 14: 653-9.
30 Trends in MI incidence rates in the population aged 35 to 74 years i Gerona 1990-2003 Gil M REGICOR. Rev Esp Cardiol 2007-60-349.
Disease prevention Screening POPULATIONPopulation individualsPatientsPatients Genetic Characteristics Risk Factors Reccurrences Disease Primordial prevention Secondary Prevention Primary Prevention Inappropriate Life Styles
Finland Japan 190 230 Population distribution of total cholesterol CHD CHD mg/dL
Population distribution of total cholesterol & CHD incidence CHD incidence CHD incidence 200 220 mg/dL
Population & MI patient distribution of total cholesterol in high incidence countries Population MI patients 220 200 mg/dL
Homes Dones REGICOR adaptada versió 2010
The ideal risk function… Braunwald, JACC 2006 Many events Highest Risk High Intermediate Lesser # of events Low
CHD risk, and 10-year CHD event incidence in the REGICOR population cohort (n=3200)
CHD risk, and 5-year CHD event incidence in the primary care VERIFICA cohort (n=4500)
Stimulate healthy lifestyles, appropriate weight and follow-up Intensive intervention on risk factors Low CVD risk Moderate High What else can be done in XXIst century?
No risk factor reaches individually the ideal AUC …so we combine factors… …that are usually correlated among them
Risk modifiers influence atherogenesis through effects on inflammation as reflected by biomarkers of the acute phase response Libby P. EHJ 2010; 31: 777
The 22 more abundant proteins, including albumin & immunoglobulins, constitute 99% of the plasmatic proteome mass. Many biologically interesting molecules circulate in very small concentrations: Troponin: nanomolar (10-6) concentration Insulin: picomolar (10-9) concentration TNF: femtomolar (10-12) concentration Potential biomarkers in CV diseases Anderson, N. L. et al. The human plasma proteome: a nonredundant list developed by combination of four separate sources. Mol. Cell. Proteomics 3, 311–326 (2004).
Biomarkers Plasma: >2x10⁴ >2x10⁴ >3x10⁵ Anderson, N. L. et al. Mol. Cell. Proteomics 3, 311–326 (2004).
Área bajo la curva de muerte o eventos CV mayorescon factores emergentes.Proteína C reactive; Péptido natriurético B, Péptido natriurético N-terminal pro–auricular, aldosteronemia sérica,renina plasmática; fibrinógeno; inhibidor del activador del plasminogeno tipo 1; Dimero D; homocisteína; y el cociente albumina en orina / creatinina. Wang TJ et al. NEJM 2006;355:2631
Recently some researchers proposed level of reclassification as a measure of added utility: Net Reclassification Improvement* They categorized individuals into meaningful CHD-risk categories (say <5%, 5-10%, 10-15%,>15%) based on risks predicted using models with and without the new marker and measured the amount of “reshuffling”. Reclassification • *Cook, Circulation 2007. Steyerberg et al Epidemiology 2010; 21:128-38
Adjusted AUC for different models with traditional risk factors and CIMTin ARIC Study AUC area under the curve; CI confidence interval; CIMT carotid intima-media thickness; TRF traditional risk factors. Nambi et al. JACC . 2010; 55: 1600-7
Number and % reclassification with CIMT and plaque information are added to traditional risk prediction modelsin ARIC Study Reclassification Overall NRI Clinical NRI (5-10 10-20 or 10-20 >20%) Overall sample 9.9% 21.7% Men 8.9% 16.4% Women 9.8% 25.4% Nambi et al. JACC 2010; 55: 1600-7
Ultrasound carotid intima media thickness (IMT). Ankle brachial index is inexpensive, easy-to-measure with some training. Some informative non-invasive tests
IMT C-IMT & ABI do not indicate increased CVD risk … but existing disease! Estenosis
Preclinical disease Possible factors for the reclassification of candidates to CVD primary prevention • HS C reactive Protein > 1g/l, • Family history of early ECV, • Obesity (BMI > 30), or waist > recommended values, • Microalbuminuria or renal failure, • Inappropriate diet (self-administered short questionnaire) • Insufficient exercise (self-administered short questionnaire) • Adverse genetic profile (predisposition/genetic burden), • Carotid IMT • Feeble/undetectable paedial pulse or ABI<0.9
Heritability (h2) • The proportion of total phenotypic variance that is explained by genetic variance at the population level. • MYOCARDIAL INFARCTION: h2 = 0.56. • (Nora JJ, et al. Circulation 1980;61:503-8.) • CORONARY HEART DISEASE MORTALITY: h2 =0.53-0.57 • (Zdravkovic S, et al. J Intern Med 2002;252:247-54. Wienke A, et al. Twin Res 2001;4:266-74.) • CAROTID ARTERIOSCLEROSIS: h2 = 0.09-0.67 • (Xiang AH, et al. Arterioscler Thromb Vasc Biol 2002;22:843-8; Fox CS, et al. Stroke. 2003;34:397-401; Juo SH, et al. Stroke 2004;35:2243-7; Swan L, et al. Atherosclerosis 2003;166:137-41; • North KE, et al. Arterioscler Thromb Vasc Biol 2002;22:1698-703; Hunt KJ, et al. Stroke 2002;33:2775-80.) • INTROCORONARY CALCIUM: h2 = 0.42 • (Peyser PA, et al. Circulation 2002;106:304-8.)
Coronary heart disease: Complex disease • Polygenic: different loci/genes are defining the individual susceptibility. • Allelic heterogeneity: different variants in each locus/gene are defining the individual susceptibility. • Gen-gen interactions. • Environment-environment interactions • Gen-environment interactions
New variants for MI or CAD via GWAS Myocardial Infarction Genetics Consortium 32
Allelic dosage and MI risk p=2x10-18 Allelic dosage quintiles (9 SNPs) MIGen Consortium. Nat Gen 2009;41:334-41.
Graphic CV risk representation (35 to 74 y) by REGICOR risk function with CRF and with CAD genetics alone Genetic risc+smoking+hypertension+dyslipaemia Genetic risc+hypertension+dyslipaemia Genetic risc+dyslipaemia Genetic risc alone Average 10-year CV risk Age (years)
Proof of concept—Do novel genetic markers, non associated with classical risk factors, differ between subjects with and without CHD? In silico case-control study: on the Wellcome Trust Case Control Consortium public data Prospective validation—Incremental value: Cohort studies: REGICOR Framingham …
Distribution of the number of risk alleles in cases and controls Distribution of the number of alleles in CHD cases and controls Number of risk alleles in the 9 variants of interest (0 to 18 alleles) OR per allele = 1.18 Lluis-Ganella C…Elosua R. REC 2010 (in press)
# Cases Alleles # Controls OR (95% IC) P value Odds ratio for the cumulated number of MI risk alleles 7 alleles is the median (and reference group) Lluis-Ganella C…Elosua R. REC 2010 (in press)
Odds ratio for CHD across genetic score quintiles Genetic score quintiles # Controls # Cases Alleles OR (95% IC) P value Lluis-Ganella C…Elosua R. REC 2010 (in press)
Comparison of the effect (OR) of quintiles of the cumulated # of adverse alleles with that of total cholesterol Lluis-Ganella C…Elosua R. REC 2010 (in press)
Comparison of the effect (OR) of quintiles of the cumulated # of adverse alleles with that of hypertension Lluis-Ganella C…Elosua R. REC 2010 (in press)
Proof of concept—Do novel genetic markers, non associated with classical risk factors, differ between subjects with and without CHD? In silico case-control study: on the Wellcome Trust Case Control Consortium public data Prospective validation—Incremental value: Cohort studies: REGICOR Framingham … • No improvement in c-statistics (AUC). • Significant improvement in reclassification • NRI: 15.2 %
Some advantatges of determining the cardiovascular risk genotype over other biomarkers Genetic characteristics : • Does not change with age or sex • Does not change with food • Does not change with drugs • Does not have intra-individual variability • Need to determined only once in life (or until new markers are found)
CHD/CVD screening • Risk charts: screening basic system • First level of Reclassification • Biomarkers • Genetic predisposition • Second level of reclassification • Exercise test, ABI, C-IMT • Non-invasive angiography • Diagnostic Confirmation • Coronary angiography • PCI / other revascularization • Population • Individuals • Individuals • Patients • Patients
C VDR I S K Simplified figure for potential use of emerging risk factors and imaging techniques in CV primary prevention Imaging Biomarkers, Genetic risk Preclinical disease: IMT-c & ABI Classical Risk Factors
Promoting healthy life-styles and appropriate BMI. Follow-up / 5 years Low <5% 10-year CVD Risk REGICOR Intermediate 5-10% >1 additional tests† Intensive intervention on risk factors. Annual follow-up High >10% >1 additional tests † †HS C reactive Protein > 1g/l, Family history of ECV prematura, Carotid IMT, Feeble/undetectable paedial pulse or ABI<0.9, Obesity (BMI > 30), or waist > recommended values, Microalbuminuria or renal failure, Inappropriate diet, Insufficient exercise Adverse genetic profile (once in a life span) Non-invasive coronary angiography for vulnerable plaque* Treatment of lesions Very high risk Coronary angiography Exercise test Assymptomatic population with no CVD history Extremely high risk
Number/1,000 <= 2.4 2.4 to 4.8 4.8 to 7.2 7.2 to 9.6 9.6 to 12.0 No data STANDARDISED CARDIOVASCULAR MORTALITY ~ 2004 MEN ESC Report Cardiovascular Diseases in Europe 2006. WHO data; June 2006.
Positive remodeling (+),Soft plaque (+), Fibrous plaque (+), Calcification (-) Coronary angiography Tomografía computerizada multicorte con multidetectores LAD Motoyama et al. ACC 2006
Non-invasive tests Coronary Calcium score (CT) increases with age, lowpredictive capacity, Magnetic Ressonance Limited resolution expensive CT MD expensive, high irradiation, but promising… Clarifying Uncertainity
Standardized CAD mortality rates in Europe (1995-2002) World Health Statistics. World Health Organization. Geneve, 2000. (versión on-line enhttp://www.who.int/ncd_surveillance/infobase/web/InfoBasePolicyMaker/Reports/).