PHY1012F MOTION
PHY1012F MOTION. Gregor Leigh gregor.leigh@uct.ac.za. WHAT IS PHYSICS?. Physics attempts to provide a description of the fundamental principles of the universe. Physics is based on experiment and measurement.

PHY1012F MOTION
E N D
Presentation Transcript
PHY1012FMOTION Gregor Leighgregor.leigh@uct.ac.za
WHAT IS PHYSICS? • Physics attempts to provide a description of the fundamental principles of the universe. • Physics is based on experiment and measurement. • Hypotheses proposed to explain phenomena are repeatedly tested; those which survive become our current theories which inform our models of reality – until further testing proves them inadequate or wrong! • I.e. Physics provides transparent and reliable, yet still tentative, knowledge. • Physics is the most fundamental of the sciences: it provides a basis for other sciences to build on.
Motion NEWTON’S LAWS • Physics is particularly interested in the measurement of change. • One of the most dramatic examples of change is…
NEWTON’S LAWS • Physics is interested in the measurement of change. • One of the most dramatic examples of change is motion. • The goals of Part I, Newton’s Laws, are to… • Learn how to describe motion both qualitatively and quantitatively so that, ultimately, we can analyse it mathematically. • Develop a “Newtonian intuition” for the explanation of motion: the connection between force and acceleration.
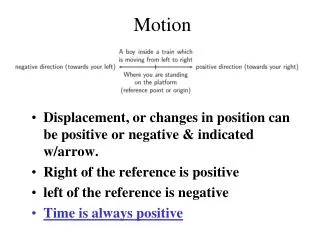
DESCRIBING MOTION • Motion can be represented in multiple ways… • Verbally, as in typical physics, or “story sum” problems. • Physically, as in motion diagrams. • Pictorially, showing beginning and ending points as well as coordinates and symbols. • Graphically, using graphs of motion (velocity-time etc). • Mathematically, through the relevant equations of kinematics and dynamics.
MODELLING • Physics is NOT always about being exact! • To cope with the complexities of reality, physicists often simplify situations by … • isolating essentials • ignoring unnecessary details • making assumptions • i.e. modelling reality
MAKING A MOTION DIAGRAM • Essentially motion means a change of position with time. A film strip consists of single images taken at regular time intervals. If we cut out the individual frames…
MOTION DIAGRAMS • … and stack them on top of each other … … we get a motion diagram. Notes: • Do not “pan”. • Use regular timeintervals. • Choose an appropriate viewing angle.
start 3 2 1 0 PARTICLE MODEL • For simple translational motion (not rotational motion, qv), we treat objects as if all their mass were at a single point. stop The stopping car becomes: 0 1 2 3 • Numbers are used to show order. (NB Start at zero.) • “Stop” is used to indicate a final position of rest (as opposed to mere slowing down). • “Start” indicates an initial position of rest. E.g. A horse out of a starting gate:
3 4 2 y (m) 5 5 4321 1 (5 m, 3.5 m) 6 = (6.1 m, 35°) 0 35° 1 2 3 4 5 6 x (m) • or specify the position vector, = (6.1 m, 35°). MEASURING POSITION • To give a quantitative description of the position of a body at a particular time (say t5) we… • overlay the motion diagram with an artificial grid, i.e. a coordinate system, and… • either state the coordinates, (x5, y5) = (5 m, 3.5 m)…
SCALARS and VECTORS • Scalar A scalar is a physical quantity with magnitude (size) but no associated direction. E.g. temperature, energy, mass. Vector A vector is a physical quantity which has both magnitude AND direction. E.g. displacement, velocity, force. Vectors are very useful tools for describing physical quantities in two and three dimensions.
VECTOR REPRESENTATION and NOTATION • Graphically, a vector is represented by a ray.The length of the ray represents the magnitude, while the arrow indicates the direction. NB!! Directions and angles are ALWAYS measured at the TAIL of a vector! The positionof the ray is unimportant. Provided its length and direction remain unchanged, it may be “shifted around”, i.e. drawn anywhere on the page, as required. Symbolically, to distinguish a vector from a scalar we will use an arrow over the letter. E.g. and .
y (m) 5 4 3 2 1 1 2 3 4 5 6 x (m) DISPLACEMENT Changing position (i.e. moving) involves the displacement vector, . 3 4 2 5 1 The displacement is what is added to the initial position, , in order to result in getting to the final position, . 6 0 Mathematically, Alternatively, displacement can be defined as the difference between one position and the previous one.
Draw . • Drag until its tail lies on ’s head. • The resultant, , is drawn from the tail of the first to the head of the last. VECTOR ADDITION • To add to :
VECTOR ADDITION • Simple geometry shows us that vector addition is commutative:
VECTOR SUBTRACTION • To subtract one vector from another, we simply add the negative of the vector to be subtracted: …where is the vector with the same magnitude as , but pointing in the opposite direction:
Draw . • Draw with its tail on ’s head. • The resultant, , is drawn from the tail of the first to the head of the last. VECTOR SUBRACTION • To subtract from :
stop This motion diagram illustrates a body moving to the right, initially at constant speed ( )… …then slowing down to a halt ( , and become progressively shorter). MOTION DIAGRAMS WITH VECTORS • By adding displacement vectors to motion diagrams the pictures become more informative, even though we can now omit the position numbers:
The time interval t=tf – ti measures the elapsed time as an object moves from an initial position at time ti to a final position at time tf. MEASURING TIME • In physics we are concerned with time intervals rather than actual times. The value of tis independent of the specific clock used to measure the actual times.
SPEED • Speed is a measure of how fast an object moves, i.e. the amount of distance it covers during a given time interval. More formally: No attention is paid to the direction in which the object moves, so speed is a scalar quantity. Of more use to physicists (and aircraft carrier pilots) is the vector equivalent of speed: velocity…
VELOCITY • Velocity is a measure of the rate of change of position. Mathematically: Notes: • The velocity vector points in the same direction as the displacement vector, the “direction of motion”. • For the moment we shall drop the “avg” subscript and blur the distinction between average and instantaneous velocity (qv). • Beware of regarding velocity as simply “speed plus direction”.
MOTION DIAGRAMS WITH VECTORS • From now on we shall use velocity vectors in place of displacement vectors in motion diagrams: The hare The tortoise Notes: • As in the case of displacement vectors, velocity vectors join successive positions together. • The length of the velocity vector represents the body’s average speed between the two points. • It’s sufficient (and easier) to label an entire sequence just once.
3 4 2 5 1 6 0 From we get , and it follows that… RELATING POSITION TO VELOCITY As we have seen, an object’s next position can be found by adding its displacement vector to its previous position: I.e. an object’s velocity can be used to determine its future position. (Dead reckoning.)
ACCELERATION Velocity is a measure of the rate of change of position… Acceleration is a measure of the rate of change of velocity.
ACCELERATION Velocity is a measure of the rate of change of position… Acceleration is a measure of the rate of change of velocity. Velocity changes if… • its magnitude (speed) increases: • its magnitude (speed) decreases: • its direction changes:
ACCELERATION Acceleration is a measure of the rate of change of velocity. Mathematically: Notes: • For the moment we shall drop the “avg” subscript and blur the distinction between average and instantaneous acceleration (qv). • The acceleration vector points in the same direction as the vector , the change in velocity...
FINDING ACCELERATION VECTORS ON A MOTION DIAGRAM The change-in-velocity vector, , is the difference between the final velocity, , and the initial velocity, . That is, So to find the change we… • Draw the final velocity vector
FINDING ACCELERATION VECTORS ON A MOTION DIAGRAM The change-in-velocity vector, , is the difference between the final velocity, , and the initial velocity, . That is, So to find the change we… • Draw at the head of the final velocity vector
FINDING ACCELERATION VECTORS ON A MOTION DIAGRAM The change-in-velocity vector, , is the difference between the final velocity, , and the initial velocity, . That is, So to find the change we… • Draw , which lies in the same direction as • Draw in at the point where changes to
FINDING ACCELERATION VECTORS ON A MOTION DIAGRAM Notes: • The magnitudes of and may differ (it’s the direction which is important). • 3 position dots 2 velocity vectors 1 acceleration vector. • We cannot determine at the first and last points in a motion diagram. • From and we get…
THE COMPLETE MOTION DIAGRAM • A putt-putt (mini-golf) ball… • rolls along a smooth, horizontal section at constant speed, • passes over an edge, and then • speeds up going down a uniform slope, before • slowing down as it rolls up an equal but opposite slope. 1.
THE COMPLETE MOTION DIAGRAM • A putt-putt (mini-golf) ball… • rolls along a smooth, horizontal section at constant speed, • passes over an edge, and then • speeds up going down a uniform slope, before • slowing down as it rolls up an equal but opposite slope. 2.
THE COMPLETE MOTION DIAGRAM • A putt-putt (mini-golf) ball… • rolls along a smooth, horizontal section at constant speed, • passes over an edge, and then • speeds up going down a uniform slope, before • slowing down as it rolls up an equal but opposite slope. 3.
THE COMPLETE MOTION DIAGRAM • A putt-putt (mini-golf) ball… • rolls along a smooth, horizontal section at constant speed, • passes over an edge, and then • speeds up going down a uniform slope, before • slowing down as it rolls up an equal but opposite slope. 4.
THE COMPLETE MOTION DIAGRAM PHY1012F Acceleration is the amount by which velocity changes during each time interval. • When is zero, velocity remains constant. • If and point in the same direction, the object is speeding up. • If and point in opposite directions, the object is slowing down. • If and are not parallel, the object changes direction. 35
What quantities are shown on a complete motion diagram? AThe position of the object in each frame of the film, shown as a dot. BThe average velocity vectors (found by connecting each dot in the motion diagram to the next with a vector arrow). CThe average acceleration vectors (there is one acceleration vector linking each two velocity vectors). DAll of the above.
THE COMPLETE MOTION DIAGRAM • You toss a ball straight up into the air… stop/start
THE COMPLETE MOTION DIAGRAM • You toss a ball straight up into the air… stop/start
THE COMPLETE MOTION DIAGRAM • You toss a ball straight up into the air… stop / start
THE COMPLETE MOTION DIAGRAM • You toss a ball straight up into the air… stop start The acceleration vectors are the same on the way up and the way down… and even at the top!!
45° THE COMPLETE MOTION DIAGRAM • Putting the shot…
THE COMPLETE MOTION DIAGRAM • Orbiting tennis ball…
THE COMPLETE MOTION DIAGRAM • Orbiting tennis ball…
THE COMPLETE MOTION DIAGRAM PositionsVelocity vectorsAcceleration vectors • When is zero, velocity remains constant. • If and point in the same direction, the object is speeding up. • If and point in opposite directions, the object is slowing down. • If and are not collinear, the object changes direction.
DESCRIBING MOTION • Motion can be represented in multiple ways… • Verbally, as in typical physics, or “story sum” problems. • Physically, as in motion diagrams. • Pictorially, showing beginning and ending points as well as coordinates and symbols. • Graphically, using graphs of motion (velocity-time etc). • Mathematically, through the relevant equations of kinematics and dynamics.
PICTORIAL REPRESENTATIONS • Sketch the situation: beginning, end, and any point where the motion changes. • Establish an appropriate coordinate system. • Fill in all variables, both known and yet-to-be-found. • List known information in table form. • Include desired unknowns in the table.
PICTORIAL REPRESENTATIONS A rocket sled accelerates at 50 m/s2 for 5 s, then coasts for 3 s. What total distance does it travel? • Sketch the situation: beginning, end, and where the motion changes.
y • x PICTORIAL REPRESENTATIONS A rocket sled accelerates at 50 m/s2 for 5 s, then coasts for 3 s. What total distance does it travel? • Establish an appropriate coordinate system.
y • x PICTORIAL REPRESENTATIONS A rocket sled accelerates at 50 m/s2 for 5 s, then coasts for 3 s. What total distance does it travel? • a0x • a1x • x0 • , v0x • , t0 • x1, v1x, t1 • x2, v2x, t2 • Fill in all variables, both known and yet-to-be-found.
y • x PICTORIAL REPRESENTATIONS A rocket sled accelerates at 50 m/s2 for 5 s, then coasts for 3 s. What total distance does it travel? • x0 = v0x = t0 = 0 • a0x = +50 m/s2 • t1 = 5 s • a1x = 0 m/s2 • t2 = t1 + 3 s = 8 s • x2 = ? • a0x • a1x • x0, v0x, t0 • x1, v1x, t1 • x2, v2x, t2 • List known and desired unknown information in table form.