Download
1 / 30
300 likes | 446 Views
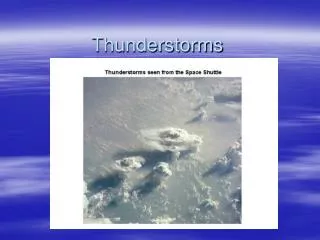
Ionospheric Observations Over Active Thunderstorms. Michael C. Kelley Cornell University, Ithaca, NY. History. Five Cornell rockets One University of Minnesota rocket University of Alaska airglow University of Stanford Early observations of sporadic E Theory of sporadic E

E N D
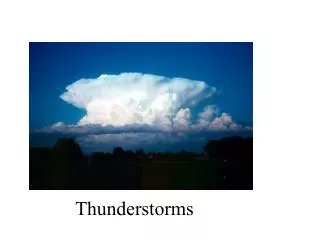
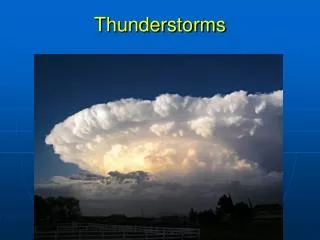
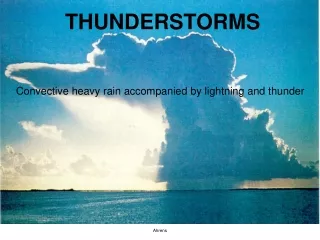
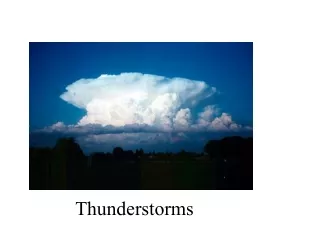
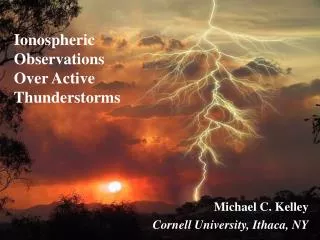
Ionospheric Observations Over Active Thunderstorms Michael C. Kelley Cornell University, Ithaca, NY
History • Five Cornell rockets • One University of Minnesota rocket • University of Alaska airglow • University of Stanford • Early observations of sporadic E • Theory of sporadic E • New European data on sporadic E
Typical Launch Situation Location of cloud-to-ground strikes during the rocket flight.
Single Flash Vector electric field data in the ionosphere for a one-second period including a multiple-stroke lightning strike.
Full Spectrum Electric field perpendicular to B from 20 kHz to 2 MHz. The highest group velocity is near 80 kHz.
Parallel and Perpendicular Field Parallel and perpendicular fields from a lightning stroke located 245 km from the rocket subtrack and measured at an altitude of 115 km.
Optical / Parallel E Comparison A field-aligned pulse from a CG lightning stroke measured at 139 km altitude. The upper trace shows the optical signature of the lightning stroke measured by the rocket.
E|| Scalars with Peak Current Fall Off as 1/r The pulse amplitude decays with distance from the lightning strokes at a rate that is most consistent with 1/r but not 1/r2. Field strength as a function of distance. The parallel pulse amplitude scales with peak strike current.
Largest E|| is in the Mesosphere Parallel pulses measured at altitudes less than 90 km below the night time D region have larger amplitudes than the E-region pulses. This case was measured at 88 km altitude and originated from a lightning stroke more than 250 km distant.
Source of E||? Div Jperp = -d/dz(J||) d/dperp(SE)= -J|| + K J|| = S E/Lh For = 0.25, Lh = 10 km, and E = 5 V/m, J|| = 10 mA/m2, which is above the two-stream threshold in the F layer.
Possible Chain of Events • Electromagnetic pulse propagates to the mesosphere where 99% of the energy dissipates. • Both production and attachment processes yield horizontal density gradients. • The divergence of these current leads to field-aligned currents above the two-stream threshold. • J|| may be carried by electrons traveling at the fastest group velocity of whistler (1 keV as seen on DE-2).
Ionospheric Effects I: Electron Heating and Red-Line Emission • The pulse is short enough that electrons are accelerated as a bulk to 0.7 eV. • Between flashes, this energy is converted to heat and Te should rise to 3000 K. • Red-line emission should be observable.
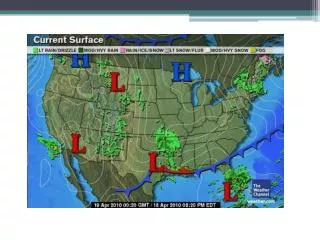
Gravity Waves Generated by Thunderstorms: Airglow Observations Journal of Atmospheric and Solar-Terrestrial Physics 65 (2003), 537–550. Simultaneous Observations of Mesospheric Gravity Waves and Sprites Generated by a Midwestern Thunderstorm D.D. Sentman, E.M. Wescott, R.H. Picard, J.R. Winick, H.C. Stenbaek-Nielsen, E.M. Dewan, D.R. Moudry, F.T. São Sabbas, M.J. Heavner, and J. Morrill GOES-8 10–12 m temperature maps of a thunderstorm over central Nebraska–western Iowa and associated lightning studied during the night of 18 August 1999. The two maps show the same storm separated by three hours. Superimposed atop the maps are 5 min averages of lightning activity, where blue denotes negative CG (cloud-to-ground) lightning, and red denotes positive CG lightning. Adapted from near-real time maps downloaded from http://www.weather.com.
Circular Pattern Above Sprites and Elves Outwardly expanding concentric ripples observed in OH emissions using 25 s time exposure in the NIR. The field of view is approximately 60 H × 40 V deg. The dashed lines labeled “analysis strip” delineate the region used to create Fig. 5. The city lights of Custer, SD and lights from the Crazy Horse Monument are labeled at the bottom of the large plot. The stars in the figure are used to fix the viewing direction using the Smithsonian Star Catalog. The sprite on the main image is shown in the inset in more detail (recorded by a separate ICCD camera).
Overlay of GOES and Airglow Pattern GOES-8 weather image with image of Fig. 3 mapped to the 85 km tangent surface and overlaid on top of it. The outward expanding ripples are seen to be nearly centered on the underlying thunderstorm. See text for description of the mapping projection used.
Vertical Structure Color-coded position–time plot of emission intensity along the horizontal analysis strip indicated in Fig. 2. The color axis runs through purple–red–yellow with increasing intensity. The waves appear to propagate outward and upward from the central vertical region of the figure. The wavelengths and periods of the waves are readily discernible from this plot, yielding a phase speed of about 60 m=s. The right-to-left drift of the bright (yellow) central region with increasing time tracks the movement of the underlying thunderstorm across Nebraska. Stars and sprites that appear within the analysis strip are labeled.
Ionospheric Effects II:Gravity Waves The long line of storms acts like a linear gravity wave antenna. The accumulated cloud-to-ground lightning flashes during the one-hour period 0000-0001 UT on July 27, 1988. JOURNAL OF GEOPHYSICAL RESEARCH, VOL. 102, NO. A1, 329-335, JANUARY 1, 1997. In situ ionospheric observations of severe weather-related gravity waves and associated small-scale plasma structure Michael C. Kelley
F-Region Response Electron density variations ±6% occur on the bottomside (only). Upleg plasma density profile from the plasma frequency probe onboard a Taurus-Nike-Tomahawk sounding rocket. Detrended version of the density profile presented in Figure 2. Detrended version of the downleg density profile.
Frequency Domain Analysis Ionosonde Frequency spectrum of the fluctuations shown in Figure 3. Rocket Digisonde data from Wallops Island for the evening of July 26-27, 1988. The various plasma frequency contours are plotted versus time.
Wave Number Spectra Energy cascade to small scales for buoyancy regime at 30 km vertical scale. Upleg and downleg spectra assuming the irregularities are field-aligned and frozen in the medium (k = 2f/V).
Ionospheric Effects III • Lower hybrid wave generation. • Also seen by radars and called explosive spread F. • No irregularities? No LHR! Journal of Atmospheric and Solar-Terrestrial Physics, 62 (2000), 1393-1404. Generation of electrostatic emissions by lightning-induced whistler-mode radiation above thunderstorms S.D. Baker, M.C. Kelley, C.M. Swenson, J. Bonnell, and D.V. Hahn Data selected for comparison of whistler and triggered emission power spectral densities were taken from points A, B, C, and D as explained in the text.
Ionospheric Effects III:Lower Hybrid Wave Generation Each lightning strike creates a pulse of lower hybrid waves by linear mode coupling on density gradients. Iov composition can be determined. Baker et al., Journal of Atmospheric and Solar-Terrestrial Physics, 62 (2000), 1393-1404.
IonosphericEffects III:Lower Hybrid Wave Generation Low plasma density leads to intense LHR, including solitary structures.
IonosphericEffects III:Lower Hybrid Wave Generation And ion heating!
Ionospheric Effects IV: Sporadic E Correlation between vertical and oblique echoes and lightning Examples of regularly spaced bursts of ionization, (a) at vertical incidence on10 ·6 Mc/s, (b) at oblique incidence on 53 ·25 Mc/s. Examples of their association with lightning are shown in (c) at vertical incidence on 10 ·6 Mc/s and in (d), (e) at oblique incidence on 53 ·25 Mc/s. G.A. Isted,Irregularities in the E region caused by atmospheric electricity, Report of the Physical Society Conference on The Physics of the Ionosphere, The Physical Society, London, 1954.
Ionospheric Effects IV: Sporadic E GEOPHYSICAL RESEARCH LETTERS, Vol. 19, No. 20, PAGES 2067-2070, OCTOBER 23, 1992. D REGION DISTURBANCES CAUSED BY ELECTROMAGNETIC PULSES FROM LIGHTNING Juan V. Rodriguez, Umran S . Inan, and Timothy K. Bell
More Sporadic E GEOPHYSICAL RESEARCH LETTERS, VOL. 35, L05815, doi:10.1029/2007GL031909, 2008 An enhancement of the ionospheric sporadic-E layer in response to negative polarity cloud-to-ground lightning C. J. Davis and Kin-Hing Lo
PROPOSED PROJECT • Nanosat for lightning detection and ionospheric effects • Photometer, e/b fields, particle detector, burst memory • Detect optical pulse and trigger burst memory • Use Tec determined from whistler dispersion to see if sporadic E is formed by each strike • Cost ~ 1$M if Cornell builds it.