Download
1 / 16
160 likes | 742 Views
FINANCIAL MANAGEMENT Concept of Time Value of Money Sampling Methods Regression - Correlation Time Series Analysis Probability Distribution Bond Valuation Linear Programming Simulation Statistical Analysis using Spread sheets. FINANCIAL MANAGEMENT Bond Valuation

E N D
FINANCIAL MANAGEMENT Concept of Time Value of Money Sampling Methods Regression - Correlation Time Series Analysis Probability Distribution Bond Valuation Linear Programming Simulation Statistical Analysis using Spread sheets
FINANCIAL MANAGEMENT Bond Valuation Short Term Funds Vs. Long Term Funds Debt Vs. Equity Debentures Vs. Bonds (100 yrs) Face Value, Coupon Rate Cash outflow, Cash Inflow Bid Price or Selling Price Ask Price or Buying Price Difference between Bid and Ask Price is also called spread
FINANCIAL MANAGEMENT Investors will pay Rs.1,000 for a six percent 3 year Treasury Bond, when the Interest rate is 6 per cent. Suppose that the interest rate is higher than the coupon rate at 15 per cent. What is the value of the bond ? PV = YI/(1+r) + YI(1+r)2 PV at 15% = Rs.60/(1.15) + Rs.60/(1.15)2 + Rs.1060(1.15)3 = Rs.794.51i.e., 79.45 per cent of the face value. Yield to Maturity – If the above bond purchased for Rs.1,010.77 then YTM =Rs.60/(1+r) + Rs.60/(1+r)2+ Rs.1,060/(1+r)3 = Rs.1,010.77 R = 5.6 % Trail or Error Method like IRR.
FINANCIAL MANAGEMENT Rate of Return: Suppose you buy the 6% Treasury bond today for Rs.1,010.77 and sell it the next year at a price of Rs.1,020. The return on your investment is Rs.60 coupon payment plus the price change of Rs.1,020-Rs.1,010.77 = Rs.9.33 The rate of return on your investment of Rs.1,010.77 is Rate of Return = Coupon Income + Price change / Investment Rs.60 + Rs.9.33 / Rs.1,010.77 = 0.686 or 6.86% Because bond prices fall when market interest rise and rise when market rates fall, the rate of return that you earn on a bond also will fluctuate with market interest rates. This is why we say bonds are subject to interest rate risk. Default risk in Bonds – CRISIL, ICRA
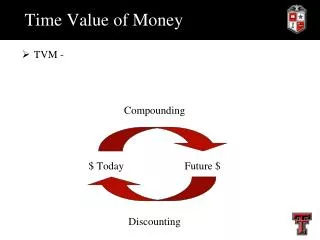
FINANCIAL MANAGEMENT TIME VALUE OF MONEY: Corporate Finance by evaluating projects and valuation of company shares and a great deal of personal finance and Investment. Cash inflows – Private or negative. The discount rate is a rate at which present and future cash flows are traded off. A higher discount rate will lead to lower present value for future cash flows. Present value (PV) = Discount Factor X CIF Suppose Investment in a venture is Rs.4,00,000, after one year you are getting Rs.5,00,000/-, the cost of debt is 9%. Calculate whether the investment is profitable or not ? (CIF / 1 + r) = Rs.5,00,000 / 1.09 = Rs.4,58,715.59 Profit of Rs.58,715.59
FINANCIAL MANAGEMENT Rule – 72 – A short cut to estimating the compounding effect. 72 provides an approximate answer to the question “ How quickly will the amount double in value” ? Effective Interest Rate Simple / Flat Interest Compound Interest (D/M/Q/H/Y) r/365,12,4,2,1 Annuities: An annuity is a constant cash flow occurring at regular intervals of Time.
FINANCIAL MANAGEMENT Linear Programming – Decision Making: This can be solved either ‘graphical’ or ‘simplex’ method. Linear Programming refers to several related mathematical techniques that are used to allocate limited resources among completing demands in an optimum way. Some examples of resource and marketing constraints: Bank may stipulate certain working capital requirements. Market may not absorb the whole output Capacity constraints Labor availability Raw Material availability
FINANCIAL MANAGEMENT Maximum Profit Minimum Profit In minimization problems, the constraints are less than or equal to (=<) constraints (different from >=) constraints)
FINANCIAL MANAGEMENT Simulation: Simulation is a way of studying effects of changes in the real system through models. We manipulate a model of the system so that we came to know the end results, without having to go through the problems in reality. Queuing problems have been extensively studied through simulation. Simulation is useful in training managers and workers in how the real system operates, in demonstrating the effects of changes in system variables and real time control.
FINANCIAL MANAGEMENT Statistical Analysis using Spread Sheets: Spread sheet programme are used in modern days to do statistical analysis. What if analysis: This helps to find out the results with different parameters, and came to an optimum decision. We will not be able to do changes in real world parameters. Types: Lotus 1-2-3, Quattro Pro; Excel-Data Session & Answer session Uses:- NPV, IRR, Graphs, Interest Calculation Adding, subtraction, Annuities, Sensitivity Analysis.
FINANCIAL MANAGEMENT Time Series: 4 Types of variation in Time series: Secular Trend – Consumer price Index Cyclical Fluctuation – Business cycle Seasonal variation – Doctor – Seasons Irregular variation – Unpredictable, Earth Quake, war etc.
FINANCIAL MANAGEMENT Trend Analysis: There are three main reasons, why we should study the trends: We will be able to describe historical patterns, which will help us to evaluate the success of previous policies. Long-term direction of the time series is given by secular trend. Past trends will help us to project the future – Some growth rate of population, GDP. We will be able to separate the trend component and eliminate it from the series, to get an accurate idea of other components like seasonal fluctuations.
FINANCIAL MANAGEMENT Probability Distribution: We can make two types of estimates about population. A point estimate and interval estimate. A point estimate is a single number that is used to estimate an unknown population parameter. An interval estimate is a range of values used to estimate a population parameter. X bar = Sigma x / n ; Variance = Standard Deviation2 Confidence level – How confident they are about their interval estimates. Confidence limits-Upper and lower boundaries of confidence intervals. Consistent estimator – An estimator which yields values more closely approaching the parameter as the sample size increases.
FINANCIAL MANAGEMENT Regression – Correlation: Regression and correlation analyses show us how to determine both the nature and strength of the relationship between the two variables. Through this method we will learn to predict, with some accuracy, the value of the unknown variable based on past observation and other factors. Correlation analysis is the statistical tool to describe the degree to which one variable is linearly related to other.
FINANCIAL MANAGEMENT Sampling: Tea tasters at tea auctions are very highly paid employees of tea companies in Kolkata. They sample a small portion of the tea produced from the plantation before the auction. So before you buy Diwali Sweets you have to have a small bite to taste it before buying it. Obviously everything cannot be opened and tasted or tested as there would be nothing left to sell !! Statisticians also used the word sample to describe a portion chosen from the population. A statistic is a characteristic of a sample; a parameter is a characteristic of al population.
Thank you very much Wish you all the Best