Download
1 / 60
600 likes | 630 Views
Explore the current status of childhood immunization in the US, its financing, inequities, causes, solutions, and adult immunization issues. Compare 20th-century disease rates to present trends, showcasing the impact of vaccines. Examine racial disparities in infections. Discover the importance of herd immunity in adults and varicella-related hospitalizations. Delve into hepatitis A incidence, vaccination trends, and financial aspects like vaccine costs and funding sources. Learn about vaccination coverage rates among children and adolescents, strategies to eliminate racial disparities, and types of immunization costs.

E N D
Childhood ImmunizationHow Far We’ve ComeAnd How Far We Have to Go Alan R. Hinman, MD, MPH Indiana Immunization Conference October 16-17, 2007
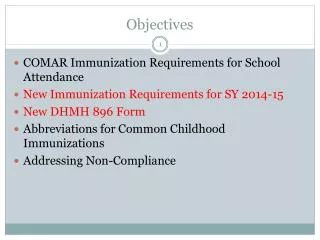
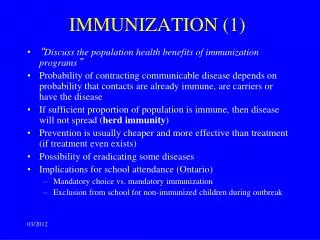
Outline of presentation • Current status of childhood immunization in the US • How immunizations are financed in the US • Inequities in financing • Causes • Possible solutions • Further issues with adult immunization
Comparison of 20th Century Typical and Current Reported Morbidity, Vaccine-Preventable Diseases Disease Pre-vaccine Era* 2005 % change Diphtheria 175,885 0 100 Measles 503,282 66 >99 Mumps 152,209 314 >99 Pertussis 147,271 25,616 83 Polio (paralytic) 16,316 1** 100 Rubella 47,745 11 >99 CRS 823 1 >99 Tetanus 1,314 27 98 Hib/unk (<5 yrs) 20,000+ 226 99 *Typically, average during 3 years before vaccine licensure **Imported, vaccine-associated poliovirus + Estimated because no national reporting existed in the prevaccine era
U.S. Haemophilus influenzae Type b Cases - 1985-2001* *2001 data provisional
Impact of PCV7 Vaccine on Racial Disparities in Invasive Strep pneumoniae Infection Flannery et al. JAMA 2004; 291: 2197 - 2203
Herd Effect in Adults 65+ YearsPCV7 types v. 16 types only in PPV ABCs 1998/99 average vs. 2003 *PPV= 23 valent pneumococcal polysaccharide vaccine
Varicella-related Hospitalization Rates*, 1994-2002 14.00 12.00 10.00 8.00 Rate (per 100,000 population) <10 yrs 10-19 yrs 6.00 20-49 yrs 0-49 yrs 4.00 2.00 0.00 1994 1995 1996 1997 1998 1999 2000 2001 2002 Year *Varicella as the primary diagnosis code Zhou F, et al. JAMA 2005
Hepatitis A Incidence by County, 1987-97 and 2005 1987-1997 2005 Rate per 100,000 0-4 5-9 10-19 20+
Incidence of hepatitis A per 100,000 population, by vaccination recommendation status, 1966-2006* Vaccination recommended in high-risk groups Vaccination recommended in high-risk areas Source: NNDSS * 2006 data provisional
Number of Vaccines in the Routine Childhood and Adolescent Immunization Schedule 1985 1995 2006 Measles Rubella Mumps Diphtheria Tetanus Pertussis Polio Hib (infant) HepB Varicella Measles Rubella Mumps Diphtheria Tetanus Pertussis Polio Hib (infant) HepB Varicella Pneumococcal disease Influenza Meningococcal disease HepA Rotavirus HPV Measles Rubella Mumps Diphtheria Tetanus Pertussis Polio 7 10 16
Increasing Vaccine-Specific Coverage Rates Among Preschool-Aged Children 2010 Target DTP(3+)† HepB (3+) PCV 7 (3+) MMR(1+) Polio (3+) Hib (3+) Varicella (1+) 2005 †DTP(3+) is not a Healthy People 2010objective. DTP(4) is used to assess Healthy People 2010 objectives. Note: Children in the USIS and NHIS were 24-35 months of age. Children in the NIS were 19-35 months of age. Source: USIS (1967-1985), NHIS (1991-1993) CDC, NCHS, and NIS (1994-December 2003), CDC, NIP and NCHS; No data from 1986-1990 due to cancellation of USIS because of budget reductions.
Vaccination coverage among children 19-35 months of age, 2006 VaccineUSAIN DTP/DTaP 4+ 85.2% 84.5% Polio 3+ 92.9% 92.4% MMR 1+ 92.4% 89.5% Hib 3+ 93.4% 90.7% Hep B 3+ 93.4% 92.1% Varicella 1+ 89.3% 88.0% PCV 3+ 87.0% 87.3%
Vaccination coverage among children 19-35 months of age, 2006 SeriesUSAIN 4+ DTP/3+ Po/1+ MCV 83.2% 82.6% 4/3/1/3+ Hib 82.3% 80.8% 4/3/1/3/3+ Hep B 80.6% 79.5% 4/3/1/3/3/1+ Varicella 77.0% 75.9%
Estimated Vaccination Coverage Among Children Enrolled in Kindergarten - United States, 2006-2007 School Year†† >3 Polio 96.3% >4 DTP 96.0% >1 MMR 95.6% >3 Hep B 96.8% >1 Var † 96.5% † or history of varicella disease †† CDC, MMWR 2007; 56:819-821
Eliminating Racial Disparity in Immunization Coverage 4:3:1:3:3:1 Estimated Vaccination Coverage by Race/Ethnicity, 19-35 Month Old Children, US National Immunization Survey, MMWR Sept 14, 2006
Immunization Coverage Rates of 19-35 month old Children in the United States, 2006† CDC. MMWR 2007;56:881-885
Estimated vaccination coverage among adolescents 13-17, US 2006 MMR 2+ 86.9% Hep B 3+ 81.3% Varicella* 89.6% Td/Tdap** 60.1% MCV 11.7% *Vaccine or disease **Since age 10 years
Types of costs in immunization • Vaccine purchase • Vaccine administration • Non-vaccine costs
Federal Contract Prices for Vaccines Recommended Universally for Children and Adolescents 1985, 1995, 2006 $1182 $155 $45 Federal contract price shown for 1985 and 1995 are averages that account for price changes within that year.
Sources of financing childhood immunizations • Government • Federal • State/local • Insurance • Private • Public • Out-of-pocket
317 Immunization Program 317 grants support: • Purchase of vaccine for free administration at local health departments • Immunization delivery • Surveillance • Communication • Education
Percent Increase of the Cost of Full Series vs. Percent Increase of Section 317 Appropriation 2005 estimate includes one dose of MCV4 and one dose of Tdap in adolescents.
Childhood Vaccine Doses Distributed by Funding SourceCalendar Year 2005 Source: Vaccine manufacturers Biologics Surveillance Data 2005 Note: Does not include influenza vaccine
How Public Health Reaches Children through VFC • VFC program has 45,000 provider sites • 75% of sites are private providers • 25% are public sector sites • Collectively, VFC providers vaccinate 90% of children • VFC vaccine for VFC-eligible children • Private purchase vaccine for other children • Improving VFC providers’ practices improves vaccinations for almost all children
Contrasts Between317 and VFC Funding Sources * Underinsured only at Federally Qualified Health Centers and Rural Health Clinics
VFC and Section 317 Vaccine Funding to Immunization Programs
Two-Tiered State Vaccination Policies at Local Health Departments • Traditionally, health department clinics vaccinated any child brought for vaccination • Underinsured children ineligible for VFC vaccine except at FQHCs and RHCs (~3,000 clinics) • VFC designated FQHCs and RHCs as safety-net providers for underinsured children • State and 317 funding used for underinsured • Due to inadequate state/317 funding, many states cannot purchase vaccine for underinsured children • Result is a two-tiered policy • Government purchased vaccine not available to underinsured at health department clinics • Access to new vaccines for some based on insurance • Ethical tension for public health officials and providers
Two-Tiered States: 2005 • Invasive pneumococcal disease • 13 states did not purchase PCV7 vaccine for underinsured children in health department clinics • Invasive meningococcal disease • 31 states did not purchase MCV4 vaccine for underinsured children in health department clinics • These states do not have a public health department safety net to vaccinate children against these diseases
Grantees Provision of Vaccines to Underinsured Children, 2006 (N=49) Source: Grace Lee et al; Harvard University
Private insurance for childhood immunizations • Approximately 53% of children <5 in 2003 • Approximately 10% considered uninsured • Most insurers cover ACIP vaccines within approximately 3 months • Many require provider to purchase vaccine – up-front costs for inventory • Reimbursement may take some time and may not cover true cost of purchase
Public insurance for childhood immunizations • Medicare • Medicaid • CHIP • Medicaid enhancement • S-CHIP
Out-of-pocket expenses for childhood immunizations • Primarily with underinsured children • Providers may refer to health departments • Exacerbated by costs of newer vaccines • May be further exacerbated by efforts to make HPV mandatory without assuring that all children have access to vaccine in public sector
Inequities in vaccine purchase - causes • Underinsurance • Inability of 317 and state/local funds to keep up with increasing vaccine costs • Burden on private providers to make large advance investments in purchasing new vaccines • Ethical dilemma at both state and provider levels
Inequities in vaccine purchase – some possible solutions • Increase 317 appropriations • Expand access to VFC for underinsured • Allow access to VFC for S-CHIP • Assure providers are fully reimbursed for purchase costs • Allow delayed payments to vaccine manufacturers/distributors
Vaccine administration • Studies indicate that it costs approximately $18-25/injection to administer vaccines • VFC does not reimburse for vaccine administration • Widely varying rates of reimbursement from Medicaid and private insurers
Inequities in vaccine administration reimbursement • Some possible solutions • Reimbursement from VFC • Minimum/recommended reimbursement rate from CMS • Negotiation with private insurers
Non-vaccine costs • Include costs of • Acquiring vaccine • Storing vaccine • Handling vaccine • Loss of vaccines • Infrastructure • Insurance
Inequities in non-vaccine costs - causes • 317 can support HD costs • VFC supports infrastructure and program costs; administration fees, in theory, include non-vaccine costs • However, Medicaid establishes reimbursement rate • Private insurers typically do not include non-vaccine costs in calculating reimbursement rates
Inequities in non-vaccine costs – some possible solutions • CMS establishes minimum or recommended reimbursement rate • Private insurers encouraged to include non-vaccine costs in reimbursement calculations
What is being done • AAP Task Force on Immunization • NVAC Financing Work Group • IDSA workgroup on adult and adolescent immunization • AMA/AAP/IDSA National Immunization Congress
Recommendations from Immunization Congress - 1 • Work with FQHCs to delegate authority to public health clinics to serve underinsured through VFC • Obtain data on cost of delivering vaccines in private practice setting and use data to educate payers and advocate for better payment • Work with manufacturers/distributors to obtain more favorable terms for payments for vaccine inventories
Recommendations from Immunization Congress - 2 • Better define components of CPT codes for immunization administration • Examine potential role of tax credits for insurers or employers in eliminating underinsurance • Create working group to explore possibility of federal vaccine purchase or funding mechanism
Recommendations from Immunization Congress - 3 • Obtain from CMS the data that led to current Medicare administration fee and use data to advocate at state level for enhanced payment • Collect data on true cost of obtaining/delivering combination vaccines as opposed to individual vaccines • Disseminate information on best business practices to minimize vaccine and administration costs
Increasing Vaccine-Specific Coverage Rates Among Preschool-Aged Children 2010 Target DTP(3+)† HepB (3+) PCV 7 (3+) MMR(1+) Polio (3+) Hib (3+) Varicella (1+) 2005 †DTP(3+) is not a Healthy People 2010objective. DTP(4) is used to assess Healthy People 2010 objectives. Note: Children in the USIS and NHIS were 24-35 months of age. Children in the NIS were 19-35 months of age. Source: USIS (1967-1985), NHIS (1991-1993) CDC, NCHS, and NIS (1994-December 2003), CDC, NIP and NCHS; No data from 1986-1990 due to cancellation of USIS because of budget reductions.
Pneumococcal vaccination coverage among adults 65 years and older, 1989-2006 Percent 2010 Target Note: NHIS data through 2005; percent receiving vaccine in 2006 is January-June interviews only. Source: National Health Interview Survey (NHIS), CDC, NCHS.
Influenza vaccination coverage during the previous 12 months, among adults 65 years and older, 1988/89-2005/06 Percent 2010 Target * Note: Percent receiving vaccine is estimated per Influenza season, using the January-June interviews only. Source: National Health Interview Survey (NHIS), CDC, NCHS. *Coverage was statistically lower than during the previous season, p<0.05
Influenza vaccination coverage during the previous 12 months among adults 65 years and older, by race/ethnicity, 1988/89-2004/05 Percent 2010 Target White, Not Hispanic Hispanic* Black, Not Hispanic *Can be of any race. Note: Percent receiving vaccine is estimated per influenza season, using the January-June interviews only. Source: National Health Interview Survey (NHIS), CDC, NCHS.
Differentiating characteristics of childhood and adult immunization • Delivery system infrastructure • Financing mechanisms • Highly effective vaccines preventing recognizable diseases • Patient/parent/societal expectations • Provider attitudes • Leadership of state/local health departments and CDC