Download
1 / 93
930 likes | 1.06k Views
This study explores how different visualizations affect Bayesian reasoning, particularly in assessing breast cancer probabilities. It employs crowdsourcing to identify effective visual aids like Euler diagrams and contingency tables for understanding complex medical statistics. The research addresses inconsistencies in previous findings regarding diagram design and comprehension, particularly among laypeople rather than focused student populations. By utilizing Amazon MTurk for demographic diversity, the study aims to find the most effective visualization to enhance understanding of Bayesian concepts and improve medical decision-making.

E N D
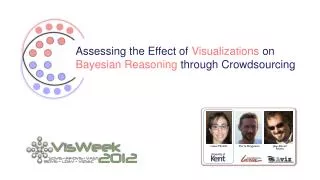
Assessing the Effect of Visualizationson Bayesian Reasoning through Crowdsourcing LuanaMicallef Pierre Dragicevic Jean-Daniel Fekete
The probability that a woman at age 40 has breast cancer is 1%. The probability that the disease is detected by a mammography is 80%. The probability that the test misdetects the disease although the patient does not have it is 9.6%. If a woman at age 40 is tested as positive, what is the probability that she indeed has breast cancer? 0% - 30% 30% - 60% 60% - 100%
The probability that a woman at age 40 has breast cancer is 1%. The probability that the disease is detected by a mammography is 80%. The probability that the test misdetects the disease although the patient does not have it is 9.6%. If a woman at age 40 is tested as positive, what is the probability that she indeed has breast cancer? 0% - 30% 30% - 60% 60% - 100%
The probability that a woman at age 40 has breast cancer is 1%. The probability that the disease is detected by a mammography is 80%. The probability that the test misdetects the disease although the patient does not have it is 9.6%. If a woman at age 40 is tested as positive, what is the probability that she indeed has breast cancer? 0% - 30% 30% - 60% 60% - 100%
95 doctors out of 100 said the answer is between70% to 80%
Why the correct answer is so low
Bayes’ Theorem P ( cancer | +ve mammography ) = P ( +ve mammography | cancer) P (+ve mammography | cancer) + P (+ve mammography | cancer)
The probability that a woman at age 40 has breast cancer is 1%. women with cancer women without cancer
If a woman at age 40 is tested as positive, what is the probability that she indeed has breast cancer? The probability that the disease is detected by a mammography is 80%. The probability that the test misdetects the disease although the patient does not have it is 9.6%. 7.8% women with cancer women without cancer
Can such visualizations facilitate Bayesian reasoning
contingency table signal detection curves trees Bayesian boxes bar-grain boxes
+ Euler diagram frequency grid
Previous Studies Mainly in Psychology Claim that Bayesian problem representation impacts comprehension
but … InconsistentfindingsMost effective Bayesian problem representation? UNCLEAR Inconsistent and sometimes inappropriate diagram designs Diagrams do not match textual information
Area-Proportional Not Area-Proportional
and the subjects … Specific background usually highly-focused university students Specific age group Sometimes, specific department carried out as part of their course
so … • cannotgeneralize their findings toa more diverse population of laypeople
Our Work Assessing the Effect of Visualizations on Bayesian Reasoning through Crowdsourcing
to identify… • - the most effective visualization for the crowd • - whether hybrid visualizations are helpful • - the link between the visualizations and different spatial and numeracy abilities
but… • how appropriate is
Amazon MTurk Used and evaluated for research and InfoVis Demographics of workers are well-understood Captures aspects of real-world problem solving better - alarge diverse population with different backgrounds, education, occupations, age, gender - workers carry out tasks rapidly but accurately to improve their rating - reduces experimental biases, as demand characteristics
168 workers with MTurk approval rate ≥ 95%
25 min $1
3 Bayesian problems classics in Psychology in natural frequencies format
followed by • objective and subjective numeracy tests • paper folding spatial abilities test • brief questionnaire