Download
1 / 19
190 likes | 348 Views
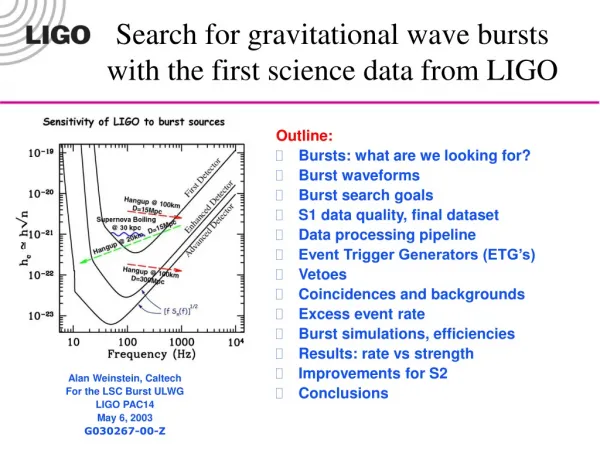
Searches for gravitational-wave bursts with LIGO. Erik Katsavounidis MIT for the LIGO Scientific Collaboration Amaldi-6 Conference Okinawa, Japan June 23, 2005. Image by Werner Benger. Data taking and burst searches at a glance. Burst search goals.

E N D
Searches for gravitational-wave bursts with LIGO Erik Katsavounidis MIT for the LIGO Scientific Collaboration Amaldi-6 Conference Okinawa, Japan June 23, 2005 Image by Werner Benger
Burst search goals • Goal: search for signals of unknown waveform and unknown origin that have short duration (<1sec) and enough power in LIGO’s sensitive band of ~100Hz to few kHz • Core collapse supernovae • Binary black hole merges • Coalescence of binary compact objects • Black hole normal modes • Cosmic string cusps and kinks • Coincidence observation with other astronomical observations: • supernovae & Gamma Ray Bursts • Use temporal and directional information to perform a cross-correlation search • GRB030329 during S2: gr-qc/0501068 (Submitted to PRD)
Progress in Burst search methodology • Rely on multi-instrument coincidence for reduction of accidentals • H1-H2-L1 • Time-frequency matching via projection onto a Fourier basis • Projection to a wavelet basis • Waveform consistency test for raw time series • Coincidence analysis with TAMA and GEO for 700-2000Hz search • Understanding data quality and investigating potential vetoes of paramount importance • A “blind” search tuned on a subset of the data • Playground O(10%) of full data • Tune the search for a low background O(<0.1) • Limitations of this approach: can’t guarantee background at the level of few events per run to be adequately studied! • Determine background by forming time-delayed coincidences • Measure detector and search response via software and hardware injections • Establish efficiency as function of signal strength • Quantify accuracy of burst parameter estimation • Use ad hoc waveforms • Invoke astrophysically motivated waveforms • Search results: • establish a bound on their rate at the instruments • interpret bound on a rate vs. strength exclusion • Scrutinize remaining events, statistical issues in setting upper limits and establishing detection
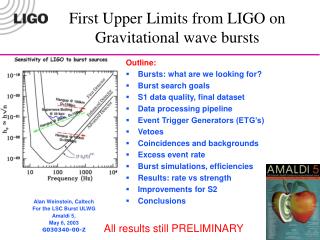
Event selection:WaveBurst pipeline Histogram of trigger significance • Excess power method in the wavelet time-frequency domain • Selects clusters in 64-1100Hz • Forming triple coincidence: • Mean time of clusters from the three instrument pairs to fall within 20ms • Frequency bands of the three pairs to overlap • Construct combined significance ZG of triple coincidence events • Apply threshold to control (WaveBurst) final triple coincidence rate • Exercise sanity by repeating on time-lagged time-series • Solid histogram: zero-lag • Black dots: non-zero-lag (background) • Select events: threshold at ZG=5.5 • Rate in playground 15 mHz Significance Threshold
(46 time lags) r-statistic G Final event cut: r-statistic test for waveform consistency • Building block of r-statistic: linear correlation coefficient of two time series: • Starting from the time and duration of a triple coincidence event established by the WaveBurst pipeline, use this statistic to test consistency of all time-series involved in the event • Calculating the statistic: • Examine all interferometer pairs • Possible physical time-delays due to ToF (+-10ms) • Integration window: 20, 50, 100ms • Compare distribution of r-values to the null hypothesis • Using playground, establish event logarithmic confidence to threshold at in order to yield target false alarm rate • S2 tuning philosophy: target for 0.1 background event, >99% of WaveBurst need to be rejected • A combined confidence of G>4 was selected
(46 time lags) S2 event analysis Microphone power vs. hour 62-100Hz band • For the remaining zero-lag event, auxiliary interferometric and environmental channels were examined • H1-H2 events resulted by an acousticdisturbance: amplitude and frequency of gravitational wave signals can be accounted for by the acoustic event recorded in simultaneity by the microphones • Acoustic veto based on power in 62-100Hz band in H2 PSL table microphone was introduced: it vetoes ~0.7% of live-time, one zero-lag event and one background event. • Background estimate is 0.025 events with 0 events observed over the (239.5-1.7) hours of the S2 analysis • 90% CL upper limit is 2.6 events • Accounts for modified coverage due to introduction of post-facto veto • Rate upper limit of 0.26 events/day r-statistic Γ
Detection Efficiency Studies • Measure test waveform efficiencies vs. signal strength • Different signal morphologies exercised (ad hoc and astrophysically motivated) • Sine-Gaussians, Gaussians • core collapse supernovae from three models (ZM,DFM,OB) • BBH merger (and ringdown) waveforms (Lazarus project) (two polarizations) • Simultaneous injections into ALL three instruments: antenna pattern functions and delay times between the sites were accounted for • Source sky coordinates and polarizations were taken randomly; fixed inclination taken for SN,BBH which is OK for our purposes: • Order-of-magnitude analysis • No intention to set UL on the event rate from a population of such systems • Software injections: signal added to digitized interferometer output • Hardware injection: signals added to length servo signal • Fit to asymmetric sigmoid Q=8.9 sine-Gaussian Efficiencies
WaveBurst parameter estimation • Good timing resolution: 1-sigma ~3ms (compare to ToF~10ms and coincidence window of 20ms) • Good frequency resolution: O(10%) • hrss amplitude reconstruction in good agreement with injected one
Interpreted results:rate-strength curves • S2 search detects less than 0.26 events/day at the 90% conf. level • Divide by the efficiency curve for a particular waveform to get ratevs strength exclusion region • 8% uncertainty in calibration (strain counts); choose ‘pessimistic’ one • IGEC rate at strong signals reflects the years-long observation: 0.004 events/day • Using waveform with flat spectrum near bars resonant frequencies (694-930Hz) relate hrss that is relevant to signal detection for LIGO to |h(fb)| • Optimal orientation is considered for both detectors, same conf. level of upper limit (95%)
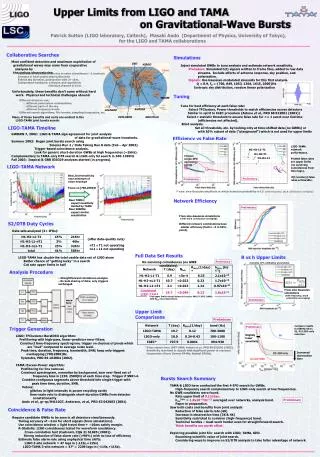
LIGO-TAMA search • LIGO - TAMA S2/DT8 joint burst search • High-frequency search uses the minimum of noise envelope: [700,2000]Hz • Complimentary to the LIGO-only S2 search • Uses similar overall methodology Detection efficiency • Maximize observation time • 19.7 days of x3/x4 coincidence observation • 6.9 days of x4 coincidence observation • No gravitational wave bursts found corresponding to a 90% upper limit of 0.12 events/day • Sine-Gaussian simulations (with sky & polarization averaging) indicate an average detection efficiency at 2x10-19 Hz-1/2 • Poster by Sutton and Ando for the LIGO and TAMA collabs Preliminary
From the S2 to the S3 search • Fact: in the absence of any events surviving all analysis cuts, S3’s livetime (~20% less than in S2) and S3’s sensitivity improvement with respect to S2 not at a level to improve S2 upper limit significantly (e.g., O(10) in the livetime-sensitivity “volume”) • Emphasis: establish the presence or not of plausible gravitational wave burst candidates during S3 • Did not set upper limit with these data • Move the overall LIGO burst search forward: address the search challenges presented by the character of the data by introducing methodology improvements • Focus in preparing for and analyzing in real-time data from the S4 running.
Methodology improvements in S3 • Multi-resolution time-frequency analysis introduced (WaveBurst: 8-16-32-64-128-256 Hz) • Better sensitivity, especially at low frequencies • Allowed to detect longer duration signals • Detection is less dependent on the waveform morphology • Stronger coincidence requirements for the two collocated Hanford (2km/4km) detectors: • Identical response to gravitational waves (except factor of 2) • Signal amplitude consistency requirement (WaveBurst) • Tighter time coincidence in checking the waveform consistency (r-stat) • Waveforms ‘in phase’ by checking the sign of their correlation (r-stat) • Extension of the playground to entire run’s time-shifted data • Larger variety of waveform morphologies (58 wfs) in efficiency Monte Carlos: • All of the above were benchmarked H1-H2 Amplitude Comparison Red: injections Blue: background ½<H1/H2<2: false dismissal~0.4% background events ~76%
S3 Data analysis • Simulated events imitating the signatures expected from sources uniformly positioned on the sky, with varying strength amplitude and waveform morphology • Background events generated by 50 time-shifts of the S3 data in multiples of 4.25 seconds • Analysis cuts established: • Central frequency in the 100-1100Hz • A positive H1-H2 correlation • An H1-H2 amplitude consistency within a factor of two • WaveBurst confidence>3.2 • r-statistic confidence>10 • Foreground events (zero-lag) • None remains • Background events (from a new set of time-shifted data): • 4 out of 5 attributed to the same calibration drop-out at Hanford • Identified as calibration line drop-out at Hanford and decided to veto out!
Efficiency studies • S3 simulation Monte Carlos extend the waveform morphology adopted by the S2 search in order to investigate signals beyond the nominal minimum uncertainty ones. • Caveats: • Efficiency studies were performed in only a (randomly selected) 10% sample of the full set. Potential systematic due to this is not anticipated to be large. • On the other hand, a higher overlap window for the waveform consistency check that was adopted in the analysis of the real data was not implemented in the simulation work. This implies an underestimation of the detection efficiency. • Representative (and preliminary) sensitivities in units of 10-20 /sqrt(Hz):
LIGO-GEO • During S4, 56 hours of L1-H1-H2-G1 coincidence, 106 hours of H1-H2-G1 coincidence • Prototypical search for the LIGO-GEO network • Focuses on high-frequency signatures: 700-2000Hz • Builds on the LIGO-only S3 waveburst pipeline • Work in progress: • 10 μHz background rate • Sine-Gaussian simulations (with sky & polarization averaging) indicate detection efficiency at the level of 3.4-10x10-20 Hz-1/2 • Poster by Heng for the LIGO Scientific Collaboration
Summary of the S3 burst search • No events consistent with a gravitational wave burst were seen during LIGO’s S3 • The search was performed over 192.2 hours of triple coincidence data. The expected background was 0.02 events • An improved methodology and simulation infrastructure was introduced and is planned to be further exploited in the ongoing S4 work • Tentative efficiency studies set the scale of the S3 search to approximately half of S2’s • A LIGO-GEO prototypical search is in progress
Search for bursts in S4 citius, • … • A near real-time detailed look at the data: • less glitchy than previous runs • an end-to-end search for strong bursts was performed altius, • … • Instruments within a factor of two of design sensitivity • 30 days of data taking, 57% x3 coincidence (~17 days) fortius ! • … • Off-line analysis in full-swing: expected livetime-sensitivity “volume” improvement by a factor of ~25 w/r/t S2 • Poster on S4 burst search by Igor Yakushin for the LSC
GEO VIRGO LIGO TAMA NIOBE AURIGA ALLEGRO EXPLORER NAUTILUS LSC burst searchsummary and outlook • The LSC burst analysis working group: • Conducted searches with data collected by the instruments without observing gravitational wave bursts thus far and continuously improving their upper limits • Continues to improve the search methodology for untriggered and triggered searches of gravitational wave bursts • S4 was a successful run • Results from a search for bursts are expected by the end of the summer 2005 • As we are approaching design sensitivity and duty cycle … • Perform analyses as close to real time as feasible: we are getting ready for S5 • Operate as part of an international network of detectors: fully coherent follow-up for coincidences (e.g., Gursel-Tinto-type sky localization and waveform extraction methods)