Data Collection Instruments in Research
440 likes | 472 Views
This chapter delves into data collection instruments, focusing on validity, reliability, usability, and classification of instruments used in research to ensure accurate and objective data collection.

Data Collection Instruments in Research
E N D
Presentation Transcript
Instrumentation Chapter Seven
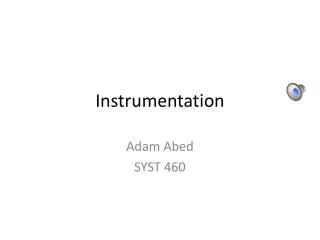
Instructions: Circle the choice that indicates your opinion. 1. Teachers’ unions should be abolished. Strongly Strongly agree Agree Undecided Disagree disagree (5) (4) (3) (2) (1) 2. School administrators should be required by law to teach at least one class in a public school classroom every year. Strongly Strongly agree Agree Undecided Disagree disagree (5) (4) (3) (2) (1) 3. Classroom teachers should be able to choose the administrators in their schools. Strongly Strongly agree Agree Undecided Disagree disagree (5) (4) (3) (2) (1) Instrumentation Chapter Seven
What are Data? • Data refers to the information researchers obtain on the subjects of their research. • Demographic information or scores from a test are examples of data collected. • The researcher has to determine what kind of data they need to collect. • The device the researcher uses to collect data is called an instrument.
Key Questions • The instruments and procedures used in collecting data is called instrumentation. • Questions arise regarding the procedures and conditions under which the instruments will be administered: • Where will the data be collected? • When will the data be collected? • How often are the data to be collected? • Who is to collect the data? • The most highly regarded types of instruments can provide useless data if administered incorrectly, by someone disliked by respondents, under noisy, inhospitable conditions, or when subjects are exhausted.
Validity, Reliability, and Objectivity • Validity is an important consideration in the choice of an instrument to be used in a research investigation • It should measure what it is supposed to measure • Researchers want instruments that will allow them to make warranted conclusions about the characteristics of the subjects they study • Reliability is another important consideration, since researchers want consistent results from instrumentation • Consistency gives researchers confidence that the results actually represent the achievement of the individuals involved • Objectivity refers to the absence of subjective judgments • This should be eliminated with regards to achievement of the subjects, even if its difficult to do so
Usability • An important consideration for any researcher in choosing or designing an instrument is how easy the instrument will actually be to use. • Some of the questions asked which assess usability are: • How long will it take to administer? • Are the directions clear? • How easy is it to score? • Do equivalent forms exist? • Have any problems been reported by others who used it? • Getting satisfactory answers can save a researcher a lot of time and energy.
Ways to Classify Instruments • Who Provides the Information? • Themselves: Self-report data • Directly or indirectly: from the subjects of the study • From informants (people who are knowledgeable about the subjects and provide this information)
Rating scales Interview schedules Tally sheets Flowcharts Performance checklists Anecdotal records Time-and-motion logs Observation forms Types of Researcher-completed Instruments
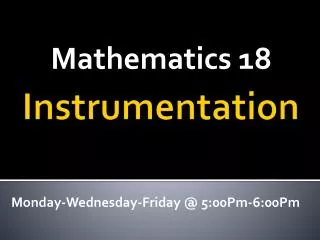
Excerpt from a Behavior Rating Scale for Teachers(Figure 7.4) Instructions: For each of the behaviors listed below, circle the appropriate number, using the following key: 5 = Excellent, 4 = Above Average, 3 = Average, 2 = Below Average, 1 = Poor. A. Explains course material clearly. 1 2 3 4 5 B. Establishes rapport with students. 1 2 3 4 5 C. Asks high-level questions. 1 2 3 4 5 D. Varies class activities. 1 2 3 4 5
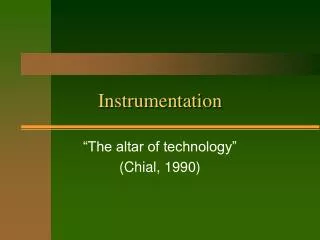
Excerpt from a Graphic Rating Scale (Figure 7.5) Instructions: Indicate the quality of the student’s participation in the following class activities by placing an X anywhere along each line. Always Frequently Occasionally Seldom Never 1. Listens to teacher’s instructions. Always Frequently Occasionally Seldom Never 2. Listens to the opinions of other students. Always Frequently Occasionally Seldom Never 3. Offers own opinions in class discussions.
Questionnaires Self-checklists Attitude scales Personality inventories Achievement/aptitude tests Performance tests Projective devices Sociometric devices Types of Subject-completed Instruments
Pictorial Attitude Scale for Use with Young Children (Figure 7.16)
Sample Items from the Picture Situation Inventory (Figure 7.22)
Item Formats • Questions used in a subject-completed instrument can take many forms but are classified as either selection or supply items. • Examples of selection items are: • True-false items • Matching items • Multiple choice items • Interpretive exercises • Examples of supply items are: • Short answer items • Essay questions
Unobtrusive Measures • Many instruments require the cooperation of the respondent in one way or another. • An intrusion into an ongoing activity could be involved which causes a form of negativity within the respondent. • To eliminate this, researchers use unobtrusive measures, data collection procedure that involve no intrusion into the naturally occurring course of events. • In most cases, no instrument is used, however, good record keeping is necessary. • They are valuable as supplements to the use of interviews and questionnaires, often providing a useful way to corroborate what more traditional data sources reveal.
Types of Scores • Quantitative data is reported in the form of scores • Scores are reported as either raw or derived scores • Raw score is the initial score obtained • Taken by itself, a raw score is difficult to interpret, since it has little meaning • Derived score are scores that have been taken from raw scores and standardized • They enable researchers to say how well the individual performed compared to others taking the same test • Examples include: • Age and Grade-level Equivalents • Percentile Ranks • Standard scores are mathematically derived scores having comparable meaning on different instruments
Raw Cumulative Percentile Score Frequency Frequency Rank 95 1 25 100 93 1 24 96 88 2 23 92 85 3 21 84 79 1 18 72 75 4 17 68 70 6 13 52 65 2 7 28 62 1 5 20 58 1 4 16 54 2 3 12 50 1 1 4 N = 25 Examples of Raw Scores and Percentile Ranks (Table 7.1)
Norm-Referenced vs. Criterion-Referenced Instruments • All derived scores give meaning to individual scores by comparing them to the scores of a group. • The group used to determine derived scores is called the norm group and the instruments that provide such scores are referred to as norm-referenced instruments. • An alternative to the use of achievement or performance instruments is to use a criterion-referenced test. • This is based on a specific goal or target (criterion) for each learner to achieve. • The difference between the two tests is that the criterion referenced tests focus more directly on instruction.
Measurement Scales • There are four types of measurement scales • Nominal Scales • Ordinal Scales • Interval Scales • Ratio Scales
Measurement Scale Characteristics Nominal Groups and labels data only; reports frequencies or percentages. Ordinal Ranks data; uses numbers only to indicate ranking. Interval Assumes that equal differences between scores really mean equal differences in the variable used. Ratio All of the above, plus true zero point. Four Types of Measurement Scales (Table 7.2)
Nominal Scales • Considered the simplest form of measurement. • Researchers assign numbers to different categories. • An example would be to assign a “1” to men, a “2” to women. • The advantage to assigning numbers to the categories is to facilitate computer analysis. • Involves groups and labels data only.
Ordinal Scales • Involves the use of numbers to rank or order scores from high to low. • An example would be the ranking of high to low scores on an examination. • Differences in rankings would not necessarily be the same with certain scores. • Ordinal scales indicate relative standing among individuals.
Interval Scales • Involves the use of numbers to represent equal intervals in different segments on a continuum. • Very similar to an ordinal scale with the exception of the equal intervals of points. • Assumes that equal differences between scores really mean equal differences in the variable measured.
Ratio Scales • A ratio scale involves the use of numbers to represent equal distances from a known “zero point”. • A scale designed to measure height would be a ratio scale since the zero point represents the absence of height. • Ratio scales are almost never encountered in Educational Research.