Download
1 / 24
240 likes | 266 Views
Dive into the fascinating world of atmospheric moisture and condensation with this comprehensive guide. Learn about the nature of water, the hydrologic cycle, evaporation, measures of humidity, and more. Explore the processes that turn water molecules into clouds and precipitation. Understand how humidity, relative humidity, and temperature influence the atmosphere. Discover the formation of clouds, condensation nuclei, and different types of fog. Delve into the classification of clouds based on height and form. Gain insights into the significance of clouds in regulating Earth's temperature and precipitation patterns. Enhance your knowledge of precipitation forms and fog types through detailed explanations and visuals. A must-read for anyone interested in atmospheric science and landscape appreciation.

E N D
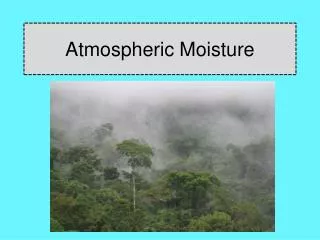
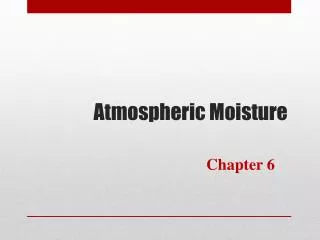
Chapter 6 Introduction to Atmospheric Moisture Physical Geography A Landscape Appreciation, 9/e Animation Edition Victoria Alapo, Instructor Geog 1150
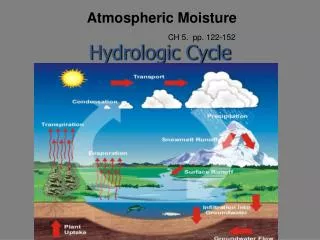
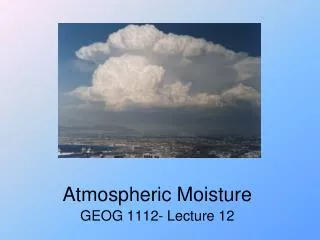
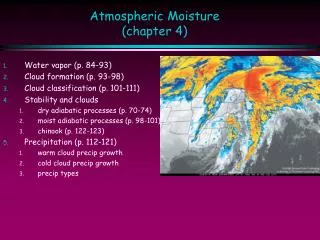
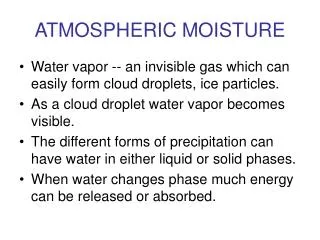
Atmospheric Moisture • The Nature of Water • The Hydrologic Cycle • Evaporation • Measures of Humidity • Condensation • The Buoyancy of Air • Precipitation • Global Distribution of Precipitation
A Water Molecule Three States of Water
Evaporation The conversion of liquid to gas (water vapor). Evaporation absorbs heat and causes cooling. It can happen ANY temperature, but more when temps are higher. Evapotranspiration is the combination of evaporation & transpiration. Transpiration is the process by which plants release moisture thru their leaves.
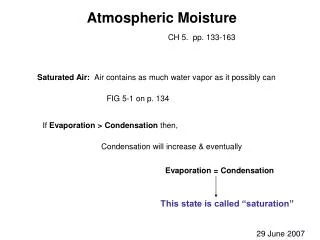
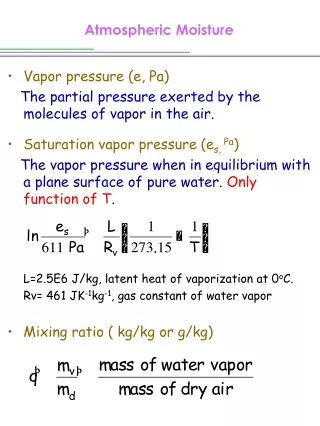
Measures of Humidity • Humidity is the amt of water vapor in the air. There are a few types: • Absolute Humidity • Specific Humidity • Vapor Pressure • Relative Humidity • The first 3 measures of humidity show the actual amt of water vapor in the air. • Dew Point – temperature at which saturation is reached.
Absolute Humidity The amt of water vapor in the given volume of air. It changes as the vol. of air changes. E.g. it decreases as you increase space (spreads), since no more water is added. See figure.
Relative Humidity Describes how close air is to saturation. Most commonly used. Not a direct measure of the amt of water vapor, but a ratio, expressed a %. It compares the actual water vapor to the capacity of air. “Capacity” is the maximum amt of water vapor than can be in the air at a given temp. Cold air has a low capacity and vice-versa, see figure 6-9. More temperature increases the capacity of air. Relative Humidity is calculated this way = Actual Water Vapor in Air (60g) x 100 Capacity (120g) Whatever the answer is, is a % of what is possible.
Relative Humidity and Temperature Temperature has an inverse relationship with relative humidity (R.H.) Temperature increases the capacity of air. And as capacity increases, relative humidity decreases, because R.H. compares what is to what CAN be.
Change of gas to liquid Water vapor to water droplets Opposite of evaporation Requirements Decrease in temperature (usually) to the dew point Condensation nuclei – hygroscopic particles around which water condenses (particulate matter like dust, bacteria, pollen, salt, smoke, etc) They get larger with more water vapor, and also as they coalesce. They only become visible to the naked eye when they’re large enough (usually in the form of haze, fog or clouds). A single raindrop can contain 1 million condensation nuclei! Fig. 6-12, Pg 153 Condensation
Condensation • Adiabatic Processes • Measures air that is moving. • Dry Adiabatic Lapse Rate (rate at which unsaturatedmoving air cools with height): 10°C/ 1000 m 5.5°F/ 1000 ft • Saturated Adiabatic Lapse Rate (rate at which saturatedmoving air cools with height): • 6°C/ 1000 m 3.3°F/ 1000 ft These are NOT the same as the Average Lapse Rate (3.6 degrees per 1000 ft, on pg 98). Average Lapse Rate measures air that is still, but with YOU climbing with a thermometer e.g. on a plane or mountain. Fig. 6-14
Fig. 6-13 • Clouds • Visible evidence of condensation. The Lifting Condensation Level (LCL) can be seen at the bottom of these clouds. This is the altitude at which condensation occurs. After this, air cools at the saturated adiabatic lapse rate. It’s rate is slower because latent heat is being released as air condenses to liquid (opposite of evaporation).
Cloud Classification • Classification • Clouds are classified based on height and shape (form) • Cloud form • Cirriform clouds Latin cirrus, “a lock of hair” • Stratiform clouds Latin stratus, “spread out” • Cumuliform clouds Latin cumulus, “mass” or “pile”. • See pics on pg 156.
Cloud Types All precipitation comes from clouds, but not all clouds produce precip. Only clouds with “nimb” in their names produce precipitation. 50% of the earth is covered with clouds. Other than for precip., clouds are impt for regulating the earth's temperature. E.g. Deserts have extremes because they are cloudless (day- and night-time temps).
Four Types of Fog • A fog is just a “cloud on the ground” (low-lying cloud). No physical difference, except in formation. • While clouds are formed by rising air, fogs are formed in 4 ways (see next slide). • Radiation fog: land looses heat at night, forcing air above it to cool. • Advection: when warm moist air moves over a cold surface (cool water, snow covered ground/cold ocean current). • Orographic: warm air forced to cool as it ascends mountain face (Smoky Mts.) • Evaporation: when water vapor evaporates and it’s added to cool air that is already near saturation.
Precipitation • Forms of Precipitation – depends on temperature & air turbulence (e.g. rain, snow, sleet, ice / glaze, hail, etc). Rain is the most common form. “Rain” (long), differs from “showers” (brief) and “drizzle” (very small drops, short time). • Atmospheric Lifting and Precipitation (4 types) • Convective Lifting • Orographic Lifting • Frontal Lifting (fronts) • Convergent Lifting
Convective Lifting Hot air rises, and cools adiabatically
Frontal Lifting Warm air is pushed over cool air and forced to cool.
Convergent Lifting Common in the ITCZ (convergence zone). When air converges, the “crowding” forces it to rise. Also found in cyclones, e.g. hurricanes.
Global Distributionof Precipitation • Average Annual Precipitation (Isohyets, see next slide) • Seasonal Precipitation Patterns (see pg 172, Fig 6-35). There's more rain in the summer in both hemispheres than in winter (look above & below equator). Notice how ITCZ shifts with summer in both hemispheres.