Download
1 / 7
70 likes | 83 Views
In this study, we have calculated the variations of cosmic ray intensity during the solar eclipses (including Annular, Total, Partial and Hybrid) from 1990 to 2017 (August) by using the online cosmic ray data from Mexico City Cosmic Ray Observatory. We haven’t found significant changes in the cosmic ray intensity during the solar eclipses in most of the cases. The increment and decrement tendencies of intensity have been observed but in 95% occasions variation didn’t go beyond 2% relative to the days close to the eclipse. The highest amount of variation found is 4.25% (decreased) during an annular eclipses in 2003. If we had analyzed the composition of the cosmic rays with their energies, we could have got a clearer picture.

E N D
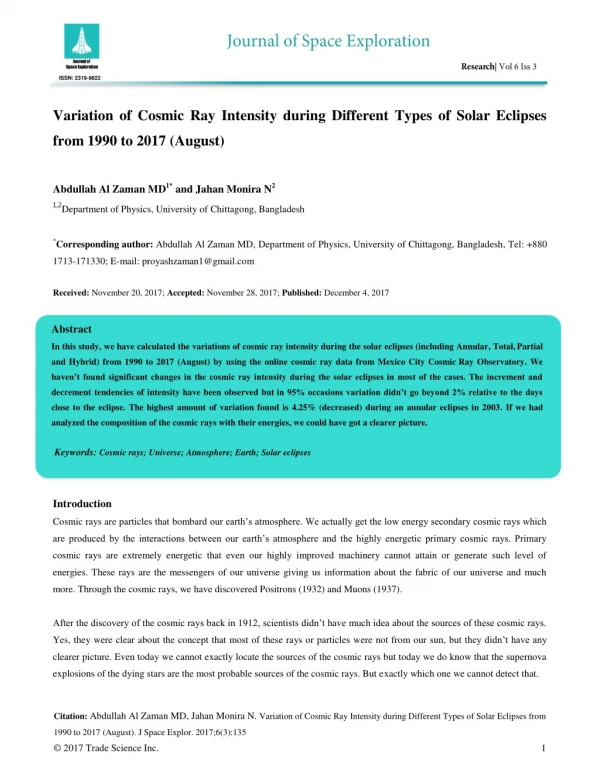
ISSN: 2319-9822 Variation of Cosmic Ray Intensity during Different Types of Solar Eclipses from 1990 to 2017 (August) Abdullah Al Zaman MD1* and Jahan Monira N2 1,2Department of Physics, University of Chittagong, Bangladesh *Corresponding author: Abdullah Al Zaman MD, Department of Physics, University of Chittagong, Bangladesh, Tel: +880 1713-171330; E-mail: proyashzaman1@gmail.com Received: November 20, 2017; Accepted: November 28, 2017; Published: December 4, 2017 Abstract In this study, we have calculated the variations of cosmic ray intensity during the solar eclipses (including Annular, Total, Partial and Hybrid) from 1990 to 2017 (August) by using the online cosmic ray data from Mexico City Cosmic Ray Observatory. We haven’t found significant changes in the cosmic ray intensity during the solar eclipses in most of the cases. The increment and decrement tendencies of intensity have been observed but in 95% occasions variation didn’t go beyond 2% relative to the days close to the eclipse. The highest amount of variation found is 4.25% (decreased) during an annular eclipses in 2003. If we had analyzed the composition of the cosmic rays with their energies, we could have got a clearer picture. Keywords:Cosmic rays; Universe; Atmosphere; Earth; Solar eclipses Introduction Cosmic rays are particles that bombard our earth’s atmosphere. We actually get the low energy secondary cosmic rays which are produced by the interactions between our earth’s atmosphere and the highly energetic primary cosmic rays. Primary cosmic rays are extremely energetic that even our highly improved machinery cannot attain or generate such level of energies. These rays are the messengers of our universe giving us information about the fabric of our universe and much more. Through the cosmic rays, we have discovered Positrons (1932) and Muons (1937). After the discovery of the cosmic rays back in 1912, scientists didn’t have much idea about the sources of these cosmic rays. Yes, they were clear about the concept that most of these rays or particles were not from our sun, but they didn’t have any clearer picture. Even today we cannot exactly locate the sources of the cosmic rays but today we do know that the supernova explosions of the dying stars are the most probable sources of the cosmic rays. But exactly which one we cannot detect that. Citation:Abdullah Al Zaman MD, Jahan Monira N. Variation of Cosmic Ray Intensity during Different Types of Solar Eclipses from 1990 to 2017 (August). J Space Explor. 2017;6(3):135 © 2017 Trade Science Inc. 1
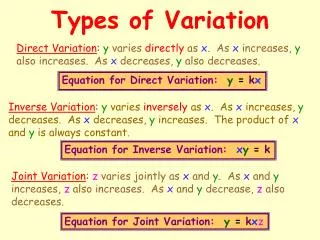
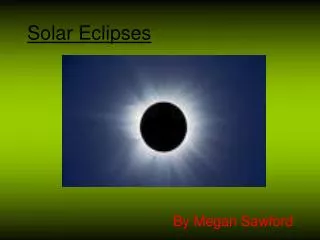
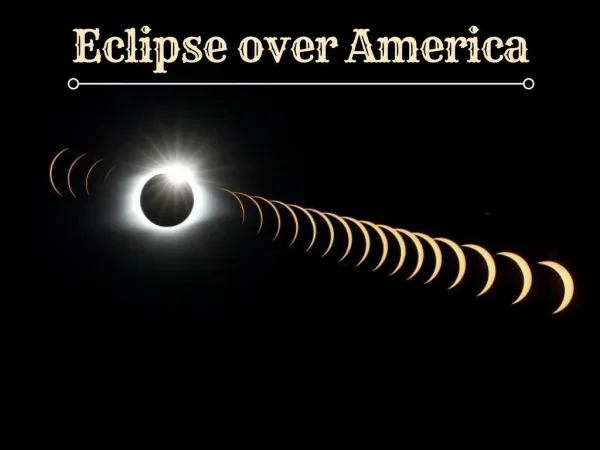
www.tsijournals.com | November-2017 Cosmic rays can be classified into two classes. First, Galactic cosmic rays, coming from different parts of our own galaxies and other galaxies and second Solar cosmic rays coming from our own star Sun. The intensity and flux of the Galactic cosmic rays are much higher than the solar cosmic rays. In fact, we get a few cosmic rays with relatively lower energies from our Sun. A solar eclipse is a celestial event in which the Moon passes between the sun and Earth and blocks all or a part of the sun for up to about three hours, from beginning to end, as viewed from a given location. There are four types of solar eclipse namely, Total, Partial, Annular and Hybrid. In a total eclipse the Sun is totally covered by the Moon i.e. the Moon completely covers the photosphere. In a partial eclipse, only a part of the photosphere is covered wherein an Annular eclipse a thin ring of very bright sunlight remains around the black disk of the Moon as the apparent size of the Moon is not large enough to completely cover the Sun. A Hybrid eclipse appears annular and total along different sections of its path. During the solar eclipse, the solar radiations are blocked by the Moon. And this depends on the type of the eclipse. There has been reporting of variations in the secondary cosmic ray flux [1-4] and geomagnetic or surface parameters [5,6]. But we have worked only with the secondary cosmic ray counts. Methodology Mexico City Cosmic Ray Observatory (FIG. 1) is a property of the National Autonomous University of Mexico UNAM (Universidad Nacional Autónoma de México, https://www.unam.mx). It detects high energy particles coming from outer space and continuously impinging on the earth´s atmosphere from all directions [7]. It is part of the World Network of Neutron Monitors. The Cosmic Ray Observatory is installed on the Campus of the UNAM (19°19'23.3"N 99°11'07.6"W). It consists of two types of detectors: a Neutron Supermonitor 6NM64 and a Muon Telescope, detecting the nucleonic and the hard components of secondary cosmic radiation, respectively. The detection range of these instruments ranges from 8.5 to 200 GeV of energy. FIG. 1. Mexico City Cosmic Ray Observatory. The Mexico City Neutron Monitor has a cutoff rigidity of 8.2 GV it is in continuous operation since 1990. The 6NM64 consists of six proportional counters of Boron Trifluoride (BF3). The intensity of cosmic radiation is affected by pressure 2
www.tsijournals.com | November-2017 changes, so it is necessary to make some corrections to the intensity detected by the instruments to eliminate the variations due to the atmosphere. To do that, the atmospheric pressure is registered concomitant to the cosmic ray intensity and a digital barometer Meteolabor-ag GB1 is used to obtain the five-minute readings of the height of the barometer. Results, Discussion and Conclusion For all types of eclipses mentioned above we’ve got both the increment and decrement in cosmic ray counts relative to the average counts before and after 10 days of eclipse. We have used equation (1) for determining relative variations in intensity. 20 ~ Averagecounts Averagecounts for days Eclipsedaycounts Relative Variation (1) 100 TABLE 1. Variation of cosmic ray counts during annular eclipses. No. of Date Eclipse day counts Average counts for 20 days 1816446 1841592 1754563 1848521 1882593 1856573 1852602 1832290 1827689 1834763 1875672 1914033 1969753 1999015 2007975 1967412 1919994 1939314 1967234 2003049 Counts status Relative variation (In %) 0.94 0.23 0.18 0.31 0.51 0.53 0.92 1.62 0.03 4.25 0.60 0.47 0.09 0.25 0.39 0.28 0.68 0.33 0.26 0.02 observations 1 2 3 4 5 6 7 8 9 10 11 12 13 14 15 16 17 18 19 20 1/26/1990 1/15/1991 1/4/1992 5/10/1994 4/29/1995 8/22/1998 2/16/1999 12/14/2001 6/10/2002 5/31/2003 10/3/2005 9/22/2006 2/7/2008 1/26/2009 1/15/2010 5/20/2012 5/10/2013 4/29/2014 9/1/2016 2/26/2017 1799461 1837356 1751490 1854282 1873060 1866409 1835541 1861947 1828319 1716736 1887000 1923063 1971616 2004097 2000215 1961979 1933108 1945674 1972346 2002738 Decreased Decreased Decreased Increased Decreased Increased Decreased Increased Increased Decreased Increased Increased Increased Increased Decreased Decreased Increased Increased Increased Decreased After analyzing the intensity of the cosmic rays for 55 different types of solar eclipses in the earth surface, we have observed that there is very small amount of variation during the solar eclipses. The intensity of the cosmic rays increased and decreased in comparison with the average intensity for before and after 10 days of the solar eclipses. The deviations were not greater than 1% most of the cases. In the very small number of occasions, the variation has crossed the 2% mark (FIG. 2 to 5 and TABLE 1,4). The highest amount of variation was found on 31st May 2003 (TABLE 1). an annular eclipse that was visible across central partiality was visible throughout Europe, Asia and far northwestern Canada. In that day the intensity was decreased by 4.25% [10]. In TABLES 3 and 4 we have just shown the data and the variation of intensity in the cosmic rays during Hybrid eclipses. Indirectly this study also shows that the cosmic rays intensity didn’t change much or almost unchanged over the period 1990-2017 [11,12]. 3
www.tsijournals.com | November-2017 Variation of cosmic rays intensity during annular solar eclipses 7.00 Relative Variation (in %) 6.00 5.00 4.00 3.00 2.00 1.00 0.00 1 2 3 4 5 6 7 8 9 10 11 12 13 14 15 16 17 18 19 20 Annular solar eclipses according to their date of occurances e.g. '1' means 26th January 1990 (TABLE 1) FIG. 2. Variation of cosmic ray counts during annular eclipses (1990-2017). The green bars signify the decrement of cosmic ray intensity where the blue bars represent the increment in cosmic ray intensity. TABLE 2. Variation of cosmic ray counts during total eclipses. No. of observations Date Eclipse day counts Average counts (for 20 days) Counts status Relative variation (In %) 1 2 3 4 5 6 7 8 9 10 11 12 13 14 15 16 17 7/22/1990 6/30/1992 11/3/1994 10/24/1995 1877425 1872909 3/9/1997 1914701 1911811 2/26/1998 1897109 1911982 Decreased 8/11/1999 1871524 1825457 6/21/2001 1818389 1812684 12/4/2002 1833745 1807143 11/23/2003 1724551 1756730 Decreased 3/29/2006 1936182 1940835 Decreased 8/1/2006 1921352 1922704 Decreased 7/22/2009 2018138 2022315 Decreased 7/11/2010 1972843 1981505 Decreased 11/13/2012 1949809 1952704 Decreased 3/9/2016 1961515 1961190 8/21/2017 1961164 1976588 Decreased 1825171 1811952 1838090 1840645 Decreased 1860758 1868229 Decreased Increased 0.73 0.14 0.40 0.24 0.15 0.78 2.52 0.31 1.47 1.83 0.24 0.07 0.21 0.44 0.15 0.02 0.78 Increased Increased Increased Increased Increased Increased 4
www.tsijournals.com | November-2017 Variation of cosmic rays intensity during total solar eclipses 3.00 Relative Variation (in %) 2.50 2.00 1.50 1.00 0.50 0.00 1 2 3 4 5 6 7 8 9 10 11 12 13 14 15 16 17 Total solar eclipses according to their date of occurances from 1990 to 2017 e.g. '1' means 22nd July 1990 (TABLE 2) FIG. 3. Variation of cosmic ray’s intensity during total solar eclipses (1990-2017). The green bars signify the decrement of cosmic ray intensity where the blue bars represent the increment in cosmic ray intensity. TABLE 3. Variation of cosmic ray’s intensity during partial eclipses. No. of observations Date Eclipse day counts 1851797 1865515 1889430 1879806 1779344 1807427 1848370 1812893 1894309 1897327 1952796 1940286 1986691 1932927 1967732 1907724 Average counts (for 20 days) 1842174 1853680 1890545 1876139 1753855 1788201 1847638 1826601 1874673 1899189 1945350 1938670 1986008 1928455 1962150 1910445 Counts status Relative variation (In %) 0.52 0.64 0.06 0.20 1.45 1.08 0.04 0.75 1.05 0.10 0.38 0.08 0.03 0.23 0.28 0.14 1 2 3 4 5 6 7 8 9 10 11 12 13 14 15 16 12/24/1992 11/13/1993 4/17/1996 10/12/1996 7/31/2000 7/1/2000 2/5/2000 12/25/2000 4/19/2004 10/14/2004 3/19/2007 9/11/2007 1/4/2011 7/1/2011 11/25/2011 10/23/2014 Increased Increased Decreased Increased Increased Increased Increased Decreased Increased Decreased Increased Increased Increased Increased Increased Decreased 5
www.tsijournals.com | November-2017 Variation of cosmic rays intensity during partial solar eclipses 1.60 Relative variation (in %) 1.40 1.20 1.00 0.80 0.60 0.40 0.20 0.00 1 2 3 4 5 6 7 8 9 10 11 12 13 14 15 16 Partial eclipses according to their date of occurances. e.g. '1' means 24th December 1992 (TABLE 3) FIG. 4. Variation of cosmic ray counts during partial eclipses (1990-2017). The green bars signify the decrement of cosmic ray intensity where the blue bars represent the increment in cosmic ray intensity. TABLE 4. Variation of cosmic ray’s intensity during hybrid eclipses. No. of observations Date Eclipse day counts Average counts (for 20 days) 1887536 1935290 Counts status Relative variation (In %) 1 2 4/8/2005 11/3/2013 1939314 1893240 Increased Increased 0.30 0.21 FIG. 5. Variation overview. However, the data is so inadequate to visualize the exact situation. We know that the cosmic rays include many types of particles. There may have some variation in the composition of cosmic rays during the solar eclipses which cannot be determined by only analyzing the intensity or the daily counts [13]. We have applied simplest of the equation to study the variations which may not be sufficient enough here. It’s only the average result while taking the data we have found some non-eclipse days where the intensity was below or average. This means that there are actually many other things that are responsible for the increase or decrease in the intensity of the cosmic rays in the earth surface which we haven’t included in our study. We can also study the variation in the energies of the particles. The raw data can be accessed from data site [14]. 6
www.tsijournals.com | November-2017 REFERENCES 1.Antonova VP, Volodichev N, Kryukov S, et al. Effect of solar eclipse on neutron flux variations at the Earth’s surface. Bull Russ Acad Sci Phys. 2007;71:1054-57. 2.Mishra RK, Agarwal R, Samson I. Influence of solar eclipses on cosmic ray intensity variations at the Earth’s surface. Proceedings of 31st Icrc, Lodz; 2009. 3.Bhattacharya R, Roy M, Biswas M, et al. Cosmic ray intensity and surface parameters during solar eclipse on 22 July 2009 at Kalyani in West Bengal. Curr Sci. 2010;98:1609-14. 4.Bhaskar A, Purohit A, Hemalatha M, et al. A study of secondary cosmic ray flux during the annular eclipse of 15 January 2010 at Rameswaram, India. Astropart Phys. 2011;35:223-29. 5.Muraleedharan PM, Nisha PG, Mohankumar K. Effect of January 15, 2010 Annular Solar Eclipse on Meteorological Parameters over Goa, India. J Atmos Solar-Terr Phys. 2011;73:1988-98. 6.Onovughe EV. Geomagnetic diurnal variation during the total solar eclipse of 29 March 2006. International Journal of Astronomy. 2013;2(4):51-55. 7.Raghav A. Confirmation of secondary cosmic ray flux enhancement during the total lunar eclipse of 10 December 2011. J Geophy Res Space Physics. 2013;118:6426-33. 8.Ruhimat M, Winarko A, Nuraeni F, et al. Effect of March 9, 2016 total solar eclipse on geomagnetic field variation. J Phys Conf Ser. 2016;771:012036. 9.Ananda Rao JN. Variation in the background counting rate at during the periods of solar and lunar eclipses. Physics Letters. 1967;25a(2):74. 10.https://eclipse.gsfc.nasa.gov/SEcat5/SE1901-2000.html. 11.https://eclipse.gsfc.nasa.gov/SEcat5/SE2001-2100.html. 12.https://www.space.com/32644-cosmic-rays.html. 13.http://www.cosm icrays.unam.mx/aboutorc.html. 14.http://bit.ly/2zW2iH0. 7