Download
1 / 9
90 likes | 112 Views
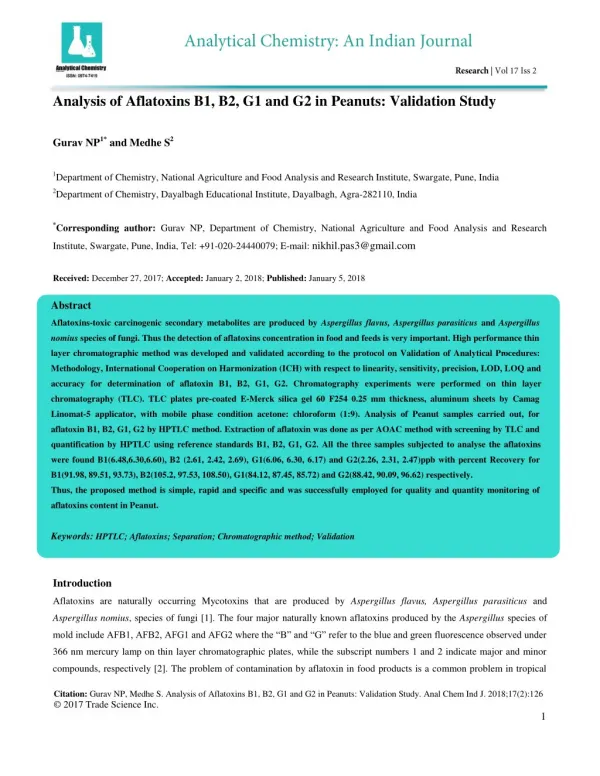
Aflatoxins-toxic carcinogenic secondary metabolites are produced by Aspergillus flavus, Aspergillus parasiticus and Aspergillus nomius species of fungi. Thus the detection of aflatoxins concentration in food and feeds is very important. High performance thin layer chromatographic method was developed and validated according to the protocol on Validation of Analytical Procedures: Methodology, International Cooperation on Harmonization (ICH) with respect to linearity, sensitivity, precision, LOD, LOQ and accuracy for determination of aflatoxin B1, B2, G1, G2. Chromatography experiments were performed on thin layer chromatography (TLC). TLC plates pre-coated E-Merck silica gel 60 F254 0.25 mm thickness, aluminum sheets by Camag Linomat-5 applicator, with mobile phase condition acetone: chloroform (1:9). Analysis of Peanut samples carried out, for aflatoxin B1, B2, G1, G2 by HPTLC method. Extraction of aflatoxin was done as per AOAC method with screening by TLC and quantification by HPTLC using reference standards B1, B2, G1, G2. All the three samples subjected to analyse the aflatoxins were found B1(6.48,6.30,6.60), B2 (2.61, 2.42, 2.69), G1(6.06, 6.30, 6.17) and G2(2.26, 2.31, 2.47)ppb with percent Recovery for B1(91.98, 89.51, 93.73), B2(105.2, 97.53, 108.50), G1(84.12, 87.45, 85.72) and G2(88.42, 90.09, 96.62) respectively. Thus, the proposed method is simple, rapid and specific and was successfully employed for quality and quantity monitoring of aflatoxins content in Peanut.

E N D
Analysis of Aflatoxins B1, B2, G1 and G2 in Peanuts: Validation Study Gurav NP1* and Medhe S2 1Department of Chemistry, National Agriculture and Food Analysis and Research Institute, Swargate, Pune, India 2Department of Chemistry, Dayalbagh Educational Institute, Dayalbagh, Agra-282110, India *Corresponding author: Gurav NP, Department of Chemistry, National Agriculture and Food Analysis and Research Institute, Swargate, Pune, India, Tel:+91-020-24440079; E-mail: nikhil.pas3@gmail.com Received: December 27, 2017; Accepted: January 2, 2018; Published: January 5, 2018 Abstract Aflatoxins-toxic carcinogenic secondary metabolites are produced by Aspergillus flavus, Aspergillus parasiticus and Aspergillus nomius species of fungi. Thus the detection of aflatoxins concentration in food and feeds is very important. High performance thin layer chromatographic method was developed and validated according to the protocol on Validation of Analytical Procedures: Methodology, International Cooperation on Harmonization (ICH) with respect to linearity, sensitivity, precision, LOD, LOQ and accuracy for determination of aflatoxin B1, B2, G1, G2. Chromatography experiments were performed on thin layer chromatography (TLC). TLC plates pre-coated E-Merck silica gel 60 F254 0.25 mm thickness, aluminum sheets by Camag Linomat-5 applicator, with mobile phase condition acetone: chloroform (1:9). Analysis of Peanut samples carried out, for aflatoxin B1, B2, G1, G2 by HPTLC method. Extraction of aflatoxin was done as per AOAC method with screening by TLC and quantification by HPTLC using reference standards B1, B2, G1, G2. All the three samples subjected to analyse the aflatoxins were found B1(6.48,6.30,6.60), B2 (2.61, 2.42, 2.69), G1(6.06, 6.30, 6.17) and G2(2.26, 2.31, 2.47)ppb with percent Recovery for B1(91.98, 89.51, 93.73), B2(105.2, 97.53, 108.50), G1(84.12, 87.45, 85.72) and G2(88.42, 90.09, 96.62) respectively. Thus, the proposed method is simple, rapid and specific and was successfully employed for quality and quantity monitoring of aflatoxins content in Peanut. Keywords: HPTLC; Aflatoxins; Separation; Chromatographic method; Validation Introduction Aflatoxins are naturally occurring Mycotoxins that are produced by Aspergillus flavus, Aspergillus parasiticus and Aspergillus nomius, species of fungi [1]. The four major naturally known aflatoxins produced by the Aspergillus species of mold include AFB1, AFB2, AFG1 and AFG2 where the “B” and “G” refer to the blue and green fluorescence observed under 366 nm mercury lamp on thin layer chromatographic plates, while the subscript numbers 1 and 2 indicate major and minor compounds, respectively [2]. The problem of contamination by aflatoxin in food products is a common problem in tropical Citation:Gurav NP, Medhe S. Analysis of Aflatoxins B1, B2, G1 and G2 in Peanuts: Validation Study. Anal Chem Ind J. 2018;17(2):126 © 2017 Trade Science Inc. 1
www.tsijournals.com | January-2018 and subtropical regions of the world [3]. The poor practices and the humid environmental condition favor the growth of fungi. The World Health Organization (WHO) classifies AFB1 as a class 1 carcinogen [4]. Aflatoxins may be present in a wide range of food commodities, particularly cereals, oil seeds, spices and tree nuts like maize, groundnuts (peanuts), pistachios, chilies, black pepper, dried fruit and figs etc. It has also been detected in milk and milk products [5]. The highest levels of aflatoxins are usually found in warmer regions of the world where there is a great deal of climatic variation [6]. It is important to recognize that, although it is primary food commodities that usually become contaminated with aflatoxins by mould growth, these toxins are very stable and may pass through quite severe processes. For this reason they can be a problem in processed foods, such as peanut butter [7]. At high enough exposure levels, aflatoxins can cause acute toxicity, and potentially death, in mammals, birds and fish, as well as in humans [8]. The liver is the principal organ affected, but high levels of aflatoxin have also been found in the lungs, kidneys, brains and hearts of individuals. Chronic toxicity is probably more important from a food safety point of view, certainly in more developed regions of the world. Aflatoxin B1 is a very potent carcinogen and a mutagen in many animals, and therefore potentially in humans, and the liver is again the main target organ. Ingestion of low levels over a long period has been implicated in primary liver cancer, chronic hepatitis, jaundice, cirrhosis and impaired nutrient conversion [9]. Aflatoxins may also play a role in other conditions, such as Reye’s syndrome and Kwashiorkor (a childhood condition linked to malnutrition) [10,11]. Less is known about the chronic toxicity of aflatoxin G1 and M1, but these are also thought to be carcinogens, though probably a little less potent than B1 [12]. Aflatoxin’s are quite stable compounds and survive relatively high temperatures with little degradation [13]. Their heat stability is influenced by other factors, such as moisture level and pH, but heating or cooking processes cannot be relied upon to destroy of aflatoxins as it destroy the essential nutrients also[14]. Materials and Methods Chemicals and reagents All the chemicals and solvents used are of analytical grade. Aflatoxin mixture (B1, B2, G1 and G2) procured from Sigma Aldrich. The analyzed samples were procured from local market. Sampling Moulds and aflatoxins occur in an extremely heterogeneous fashion in feed and food products. It is thus crucial that sampling is carried out in a way that ensures that the analytical samples be a true representative of the consignment. Failure to do this may invalidate the subsequent analysis. So the care was taken to obtain a sample of grain which is as representative as possible of the whole bulk. 2
www.tsijournals.com | January-2018 Sample preparation Aim to achieve maximum particle size reduction and thoroughness of mixing to achieve effective distribution of contaminated portions. Grind entire lot sample through hammer to pass number 14 sieve split sample sequentially in sample splitter. Regrind 1 kg portions to completely pass number 20 sieve and mix thoroughly. Weigh 50 g of sample for aflatoxin estimation. Method As per AOAC method, by TLC and HPTLC and has been quantified with reference standards. Extraction of aflatoxins The analysis of sample was carried out by weighing known quantity (50 g) of powdered sample in a 500 ml flask and treating it with 25 ml of water, 25 g Celite 545 and 250 ml of chloroform. This mixture then sonicate for 30 min with frequent stirring. It was then filtered through Whatman paper (No. 1). Collect second 50 ml portion of chloroform filtrate. Prepare the glass column of size 22 mm × 300 mm by placing ball of glass wool loosely at bottom. Adding 5 g anhydrous Na2SO4 to give base for silica gel and adding CHCl3 until tube is half full then adding 10 g silica gel (60-120 mesh previously dried at 105°C for 1 h and add 1 ml/100 g, mix well keep tightly closed for about 15 h.) slowly in column. Taking care that there should not be air gaps in the column. For that, the slurry was prepared in beaker by taking silica gel and adding chloroform in it with constant stirring. Adding 20 ml chloroform slowly and then 15 g anhydrous Na2SO4, draining the chloroform from column to just 1 cm above Na2SO4 layer. By adding 50 ml of chloroform filtrate (sample extract) to column and washing at maximum flow rate with 150 ml hexane followed by 150 ml diethyl ether and discard this washing. Eluting the aflatoxins with 150 ml methanol: Chloroform (3:97), collecting this fraction from time of addition until flow stops. Evaporating methanol- chloroform layer nearly to dryness on steam bath, by transferring residue to test tube with 5 ml of chloroform and evaporated to dryness under gentle steam of nitrogen and stored it. By dissolve the residue in 0.5 ml of Benzene: Acetonitrile (98:2) and used for TLC analysis. Examination of aflatoxins by HPTLC Plate material: Precoated silica gel 60 F254 0.25 mm thickness, E-Merck TLC plates of 10 × 10 cm and 20 × 10 cm were used for study. Plates were prewashed with the mobile phase. Sample application: The samples were applied in the form of bands (by Spray-on technique) along with standard by using CAMAG sample applicator Linomat-5. Preparation and of mobile phase and development As the standards get well resolved by double development the first mobile phase was used anhydrous ether. By pouring 20 ml of anhydrous ether in 20 cm × 10 cm of twin trough chamber and allowed to develop up to 8 cm from the lower edge of TLC plate. Let the plate to dry by evaporating the ether in dark room. 3
www.tsijournals.com | January-2018 Redevelop the above plate in same direction in Twin trough chamber once again by using chloroform: acetone (9:1) v/v as a mobile phase up to the mark after saturation of twin trough chamber. Drying Dry the plate in the air as the aflatoxins are heat and light sensitive compounds. Scanning Mount the plate on the bench of CAMAG-TLC Scanner-3. Scan the plate at 366 nm wavelength to determine the levels of aflatoxins in the samples. The detection of aflatoxins is based on their florescence property. Results and Discussion HPTLC Method development For HPTLC analysis, initially several preliminary tests were performed with different stationary phases, mobile phases and saturation time of the solvent chamber, in attempt to obtain the best separation and resolution for aflatoxins. The mobile phase consisting of chloroform: acetone (9:1) v/v and by double development gave the satisfactory separation over silica gel as stationary phase, at which a well resolved peaks for aflatoxin B1, B2, G1, G2appeared at the Rf value of 0.80, 0.67, 0.59 and 0.48 ± 0.02. Chromatogram of standard aflatoxin standards is shown in FIG. 1. Method validation parameters and results are shown in TABLE 1. FIG. 1. Chromatogram of standard aflatoxin peaks by HPTLC. 4
www.tsijournals.com | January-2018 TABLE 1. Method validation parameters of aflatoxin (B1, B2, G1, G2) using the proposed HPTLC methods. Parameters Results Wavelength (nm) 366 Retention factor (Rf) B1=0.80 ± 0.02 B2=0.67 ± 0.02 G1=0.59 ± 0.02 G2=0.48 ± 0.02 Linearity range (ng/spot) B1=0.88-8.80 B2=0.31-3.10 G1=0.99-9.90 G2=0.32-3.20 Correlation coefficient (r2) B1=0.9966 B2=0.9972 G1=0.9976 G2=0.9959 % Recovery B1=91.98 B2=105.20 G1=84.12 G2=88.42 LOD (ppb) 0.5 LOQ (ppb) 2.5 Specificity Specific Validation Method validation is the process of verifying that a procedure yields acceptable results. The developed analytical method was validated as per ICH guidelines using following parameters: Specificity: Specificity is the ability to assess unequivocally the analyte in the presence of components which may be expected to be present. The specificity of the method was appraised for the purity of the target compound. The developed HPTLC method was found to be specific, since, there is no interference of the standard aflatoxin B1, B2, G1, G2 peak with that of others as shown in FIG. 2. The contaminated samples were confirmed for the presence of aflatoxin B1, B2, G1, G2 in them by recording the Images and scanning them at 366 nm as shown in FIG. 2. All the samples contain aflatoxin B1, B2, G1, G2 in them. Peaks of aflatoxin B1, B2, G1, and G2 present in the sample appear at the same Rf, where the peaks of standard aflatoxin B1, B2, G1, G2 appeared. 5
www.tsijournals.com | January-2018 FIG. 2. Specificity study on TLC plate (Photo taken in UV chamber at 366 nm). From left to right: Band 1 and 2: Mobile Phase [Acetone: Chloroform (1:9)], 1 Band 3 and 4: Residue dissolving solvent [Benzene: Acetonitrile (98:2)] Band 5 and 6: Aflatoxin mix Standard (B1, B2, G1, G2). Linearity and range: The linearity of an analytical procedure is its ability (within a given range) to obtain test result which are directly proportional to the concentration (amount) of analyte in the sample. The linearity range of B1 (0.88 ng-8.80 ng), B2 (0.31 ng-3.10 ng), G1 (0.99 ng-9.90 ng) and G2 (0.32 ng-3.20 ng) were selected as per the response that is peak height and applied concentration. Every analysis was done in triplicate and the linearity parameters generated. 3D picture of linearity is shown in FIG. 3. Samples are analyzed for aflatoxin B1, B2, G1, G2 content in them and the graph results found are shown in FIG. 4A, 4B, 4C and 4D. FIG. 3. 3D View of linearity of standard aflatoxin mix. 6
www.tsijournals.com | January-2018 Linearity of Aflatoxin B1 Linearity of Aflatoxin B2 600 300 y = 51.595x + 2.5363 y = 19.311x + 1.0021 Height R² = 0.9972 R² = 0.9966 Height 200 400 100 200 0 0 0 5 10 15 0 5 10 15 Concentration Concentration FIG. 4A. Linearity graph of aflatoxin B1. FIG. 4B. Linearity graph of aflatoxin B2. Linearity of Aflatoxin G1 Linearity of Aflatoxin G2 500 y = 38.648x + 1.6284 200 y = 16.952x - 1.5219 R² = 0.9976 400 R² = 0.9959 Height Height 300 100 200 100 0 0 0 5 10 15 0 5 10 15 Concentration Concentration FIG. 4C. Linearity graph of aflatoxin G1. FIG. 4D. Linearity graph of aflatoxin G2. Accuracy: Accuracy is the closeness of agreement between the conventional true value or an accepted reference value and the found value. The accuracy of the method was determined by standard addition method [15]. Pre-analyzed samples (Peanut) were spiked with known amount of the standard aflatoxin added in increasing order of concentration and after developing the plate, amount of aflatoxin B1, B2, G1, G2 recovered on the plate was determined as shown in TABLE 2. TABLE 2. Aflatoxin content analysis in peanuts sample after spiking. Sr. no. Sample name No. of samples Aflatoxin content % Recovery analysed (ppb) 1 Peanuts 3 B1=6.48, 6.30, 6.60 B1=91.98, 89.51, 93.73 B2=2.61, 2.42, 2.69 B2=105.2, 97.53, 108.50 G1=6.06, 6.30, 6.17 G1=84.12, 87.45, 85.72 G2=2.26, 2.31, 2.47 G2=88.42, 90.09, 96.62 7
www.tsijournals.com | January-2018 Precision: Precision of an analytical procedure is the closeness of agreement (degree of scatter) between a series of measurements obtained from multiple sampling of the same homogeneous sample under the prescribed conditions. The CV for intra-day precision was in the range of 0.51%–1.02%. Inter-day precision of the method were determined by estimating the corresponding CV values in five different days over a period of 1 week. The CV of the method was found in the range of 0.71%–1.16%. Repeatability: Repeatability is the closeness of agreement between mutually independent test results obtained with the same method on identical test material in the same laboratory by the same operator using the same equipment within short intervals of time. During every scan, we get the similar value for peak height of the analyte, which shows the repeatability of the method. Limit of detection and quantification: The limit of detection (LOD) is the point at which a measured value is larger than the uncertainty associated with it. It is the lowest concentration of analyte in a sample that can be detected but not necessarily quantified, whereas limit of quantitation (LOQ) of an individual analytical procedure can be termed as the lowest amount of analyte in a sample which can be quantitatively determined with suitable precision and accuracy. The LOD and LOQ value of aflatoxin B1, B2, G1, G2 were calculated and found to be 0.5 ppb and 2.5 ppb, respectively indicating the adequate sensitivity of the method. Conclusion The present piece of work explores the development of new method on HPTLC to detect the B1, B2, G1, G2 aflatoxins in Peanut samples. Further, the detection level of HPTLC for B1, B2, G1, G2 aflatoxins content in samples, has been attempted. The present analysis shows that the proposed method is simple, rapid, economical, specific and could be applied for quality and quantity routine analysis of B1, B2, G1, G2 aflatoxins in food samples in absence of conventional established methods. Acknowledgements The authors are grateful to the Director Mr. Vinay Oswal of National Agriculture and Food Analysis and Research Institute (NAFARI), Pune, Maharashtra-411 042 for providing excellent facilities for conducting the research work. REFERENCES 1.Ismaiel AA, Papenbrock J. Mycotoxins: Producing fungi and mechanisms of phytotoxicity. Agriculture. 2015;5:492-537. 2.Menza NC, Margaret MW, Lucy KM, et al. Incidence, types and levels of aflatoxin in different peanuts varieties produced in Busia and Kisii Central Districts, Kenya. Open J Med Microbiol. 2015;5:209. 3.Zhang C, Selvaraj JN, Yang Q, et al. A survey of aflatoxin-producing Aspergillus sp. from peanut field soils in four agroecological zones of China. Toxins. 2017;9:40. 4.Lopez C, Ramos L, Bulacio L, et al. Aflatoxin B1 content in patients with hepatic diseases. Medicina-Buenos Aires. 2002;62:313-6. 8
www.tsijournals.com | January-2018 5.Makun HA, Anjorin ST, Moronfoye B, et al. Fungal and aflatoxin contamination of some human food commodities in Nigeria. Africa J Food Sci. 2010;4:127-35. 6.Paterson RR, Lima N. Further mycotoxin effects from climate change. Food Res Int. 2011;44:2555-66. 7.Volkel I, Schroer-Merker E, Czerny CP. The carry-over of mycotoxins in products of animal origin with special regard to its implications for the European Food Safety Legislation. Food and Nutrition Sciences. 2011;2:852-867. 8.Sahoo PK, Mukherji SC, Nayak SK, et al. Acute and subchronic toxicity of aflatoxin B1 to Rohu, Labio rohita (Hamilton). Indian J Exp Biol. 2001;39:453-8. 9.Wild CP, Montesano R. A model of interaction: Aflatoxins and hepatitis viruses in liver cancer aetiology and prevention. Cancer Lett. 2009;286:22-8. 10.Kocabas CN, Coşkun T, Yurdakök M, et al. The effects of aflatoxin B1 on the development of kwashiorkor in mice. Hum Exp Toxicol. 2003;22:155-8. 11.Rogan WJ, Yang GC, Kimbrough RD. Aflatoxin and Reye's syndrome: A study of livers from deceased cases. Arch Environ Health. 1985;40:91-5. 12.Zain ME. Impact of mycotoxins on humans and animals. J Saudi Chem Soc. 2011 ;15:129-44. 13.Andleeb S, Ashraf M, Hafeez-ur-Rehman M, et al. Effect of aflatoxin B1-contaminated feed on growth and vital organs of advance fry of, Catla catla . Japs J Anim Plant Sci. 2015;25:816-25. 14.Saalia FK, Phillips RD. Degradation of aflatoxins by extrusion cooking: Effects on nutritional quality of extrudates. Lwt-Food Sci Technol. 2011;44:1496-501. 15.Vial J, Jardi A. Quantitation by standard addition. Encyclopedia of Chromatography. 2nd ed. Taylor and Francis Group, Boca Raton, Florida. 2005. 9