Download

1 / 17
180 likes | 208 Views
Big Kola Company is losing profits in soda sales and aims to tap into the emerging Specialty Juice Market. The POM+ Project outlines priorities using a Priority Matrix, Work Breakdown Structure, and Critical Path analysis. It involves Research & Development, securing Fruit Suppliers, Production, Distribution, Legal, and preparing for Product Launch. Resource Allocations are essential for quality trials, metrics, and training. Earned Value Management indicators show cost and schedule performance, essential for project success. Business references by Cohen, Palmer, Davies, and Larson provide critical insights.

E N D
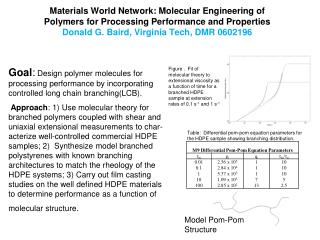
POM+ Project Squeezing the Juice Out of the Beverage Market
POM+ Project • Introduction • Priority Matrix • Work Breakdown Structure • Critical Path
POM+ Project • Resource Allocations • Earned Value Cost Indicators • Earned Value Schedule Indicators • Conclusion
Introduction • Big Kola Company soda sales • Losing profits • Emerging Specialty Juice Market • Market Research • POM+ Project
Work Breakdown Structure • Research & Development • Secure Fruit Suppliers • Initial Production • Distribution • Legal • Prepare Product Launch
Critical Path • Need survey • Set product specs • Shelf life report • Secure fruit suppliers • Equipment rehab
Critical Path, continued • Production trials • Quality trials • Quality metrics • Quality training • Prepare product launch
Critical Path, continued • Production trials • Quality trials • Quality metrics • Quality training • Prepare product launch
Earned Value Cost Indicator • CPI- .70 • EAC- $2.4 million • BAC- $1.7 million • VAC- $710,000 • TCPI- $1.15
Earned Value Schedule Indicator • SPI- .69 • SV%- .31 • SV- $184,000 Earned Value Management crucial to project success.
Conclusion • Business savvy • Priority Matrix • EVM
Cohen, M. W., & Palmer, G. R. (2004). Project Risk Identification and Management. AACE International Transactions, 1. Business Source Premier, EBSCOhost • Davies, J. R. (1995, November 6). Using work breakdown structure in project planning. Plant Engineering,49(14), 54+. Retrieved from http://go.galegroup.com/ps/i.do?id=GALE%7CA1798558 4&v=2.1&u=klnbsouthwest&it=r&p=AONE&sw=w • Larson, E. W., & Gray, C. F. (2011). Project management, the managerial process (5th ed.). New York, NY: McGraw Hill Irwin. References
Poletti, B., & Marcoux, R. (2008). Performance indicators for project management. CMA Management, 82(6), 24-28. Business Source Premier, EBSCOhost. Slack, N. (1994). The importance-performance matrix as a determinant of improvement priority. International Journal of Operations & Production Management, 14(5), 59-59. Retrieved from http://ezproxy.sckans.edu/login?url=http://search.proques t.com/docview/232337910?acco untid=13979 References