
Diffraction at Tevatron
E N D
Presentation Transcript
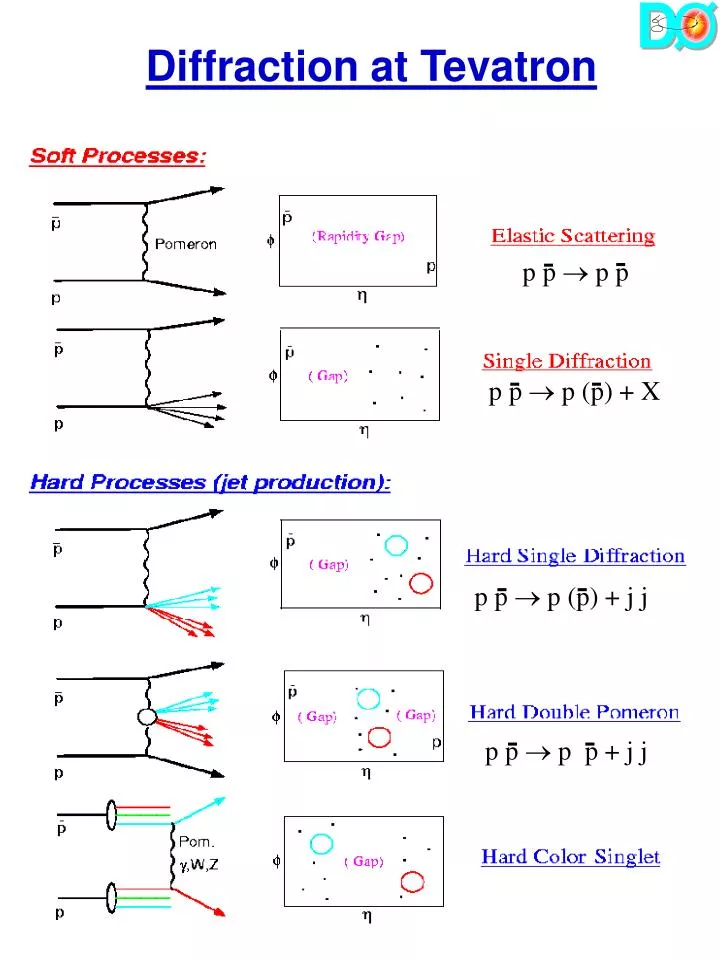
Diffraction at Tevatron p p p p p p p (p) + X p p p (p) + j j p p p p + j j
Hard Color Singlet Studies QCD color-singlet signal observed in ~ 1 % opposite-side events (p ) f Dh jet jet h Publications DØ: PRL 72, 2332(1994) CDF: PRL 74, 885 (1995) DØ: PRL 76, 734 (1996) Zeus: Phys Lett B369, 55 (1996) (7%) CDF: PRL 80, 1156 (1998) DØ: PLB 440, 189 (1998) CDF: PRL 81, 5278 (1998) H1: hep-ex/0203011 (sub. to Eur Phys J C) • Newest Results • Color-Singlet fractions at s = 630 & 1800 GeV • Color-Singlet Dependence on: Dh, ET, s (parton-x)
DØ Detector (nl0 = # tiles in L0 detector with signal 2.3 < |h| < 4.3) beam L0 Detector End Calorimeter Central Calorimeter EM Calorimeter Central Drift Chamber (ntrk = # charged tracks with |h| < 1.0) Hadronic Calorimeter (ncal = # cal towers with energy above threshold) Central Gaps EM Calorimeter ET > 200 MeV |h| < 1.0 Forward Gaps EM Calorimeter E > 150 MeV 2.0 < || < 4.1 Had. Calorimeter E > 500 MeV 3.2 < || < 5.2)
Measurement of fs Negative binomial fit to “QCD” multiplicity f Count tracks and EM Calorimeter Towers in |h| < 1.0 Dh jet jet h High-ET sample (ET > 30 GeV, s = 1800 GeV) fS = color-singlet fraction =(Ndata- Nfit)/Ntotal fS 1800 = 0.94 0.04stat 0.12sys % ET >30 GeV (Includes correction for multiple interaction contamination. Sys error dominated by background fitting.)
630 vs. 1800 Multiplicities Jet ET > 12 GeV, Jet |h| > 1.9, Dh > 4.0 Opposite-Side Data Same-Side Data 1800 GeV: ncal ntrk ntrk ncal 630 Gev: ncal ncal ntrk ntrk fS 1800(ET =19.2 GeV) = 0.54 0.06stat 0.16sys % fS 630(ET = 16.4 GeV) = 1.85 0.09stat 0.37sys % 630 R1800 = 3.4 1.2
Color Singlet Models If color-singlet couples preferentially to quarks or gluons, fraction depends on initial quark/gluon densities (parton x) larger x more quarks Gluon preference: perturbative two-gluon models have 9/4 color factor for gluons • Naive Two-Gluon model (Bj) • BFKL model: LLA BFKL dynamics Predictions: fS (ET) falls, fS (Dh) falls (2 gluon) / rises (BFKL) Quark preference: • Soft Color model: non-perturbative “rearrangement” prefers quark initiated processes (easier to neutralize color) • Photon and U(1): couple only to quarks Predictions: fS (ET) & fS (Dh) rise
Model Fits to Data Using Herwig 5.9 s = 1800 GeV Soft Color model describes data
Survival Probability • Assumed to be independent of parton x (ET , Dh) • Originally weak s dependence • Gotsman, Levin, Maor Phys. Lett B 309 (1993) • Subsequently recalculated • GLM hep-ph/9804404 • Using soft-color model • (uncertainty from MC stats and model difference) • with
BFKL: Cox, Forshaw (manhep99-7) use a non-running as to flatten the falling ET prediction of BFKL (due to higher order corrections at non-zero t) Soft Color: Gregores subsequently performed a more careful counting of states that produce color singlets to improve prediction. Modifications to Theory
Hard Single Diffraction Measure multiplicity here Measure min multiplicity here -4.0 -1.6 h 3.0 5.2 OR -5.2 -3.0 -1. h 1. 3.0 5.2 Phys Lett B 531 52 (2002) • Gap fractions (central and forward) at s = 630 & 1800 GeV • Single diffractive x distribution
630 vs. 1800 Multiplicities s = 1800 GeV: s = 630 GeV:
Event Characteristics 1800 Forward Jets Solid lines show show HSD candidate events Dashed lines show non-diffractive events • Less jets in diffractive events • Jets are narrower and more back-to-back • Diffractive events have less overall radiation • Gap fraction has little dependence on average jet ET
Comparison to MC fvisible = gap · fpredicted gap *Add diffractive multiplicity from MC to background data distribution *Fit to find percent of signal events extracted Find predicted rate POMPYT x 2 / PYTHIA *Apply same jet cuts as data, jet ET>12GeV *Full detector simulation * Model pomeron exchange in POMPYT26 (Bruni & Ingelman) * based on PYTHIA * define pomeron as beam particle * Use different structure functions
Pomeron Structure Fits • Demand data fractions composed of linear combination of hard and soft gluons, let overall s normalization and fraction of hard and soft at each energy be free parameters • If we have a s independent normalization then the data prefer : • 1800: hard gluon 0.18±0.05(stat)+0.04-0.03(syst) • 630: hard gluon 0.39±0.04(stat)+0.02-0.01(syst) • Normalization: 0.43±0.03(stat)+0.08-0.06(syst) with a confidence level of 56%. • If the hard to soft ratio is constrained the data prefer: • Hard gluon: 0.30±0.04(stat)+0.01-0.01(syst) • Norm. 1800: 0.38±0.03(stat)+0.03-0.02(syst) • Norm. 630: 0.50±0.04(stat)+0.02-0.02(syst) with a confidence level of 1.9%. • To significantly constrain quark fraction requires additional experimental measurements. • CDF determined 56% hard gluon, 44% quark but this does not describe our data without significant soft gluon or 100% quark at 630
x Calculation Where is the momentum fraction lost by the proton *Can use calorimeter only to measure *Weights particles in well-measured region *Can define for all events *Collins (hep-ph/9705393) true = calc · 2.2± 0.3 * calculation works well * not dependent on structure function or center-of-mass energy
Single Diffractive x Distributions central s = 1800 GeV forward central s = 630 GeV forward distribution for forward and central jets using (0,0) bin Dp p = 0.2 for s = 630 GeV
CDF Diffractive W CDF used asymmetry to extract diffractive component of the W signal 1)TOPOLOGY -lepton favors the hemisphere opposite the rapidity gap -compare multiplicity for region on same side of lepton vs opposite side 2)CHARGE -proton(uud) pomeron(qq) gives twice as many W+ as W- -W+ production is associated with gaps in p direction (and W- with p) Drawback: Asymmetry approach reduces statistical power of data
CDF Diffractive W CDF {PRL 78 2698 (1997)} measured RW = 1.15 ± 0.55% where RW = Ratio of diffractive/non-diffractive W a significance of 3.8
DØ Central W Multiplicity Minimum side -1.1 0 1.1 3.0 5.2 nL0 ncal nL0 L0 ncal ncal Peak at (0,0) indicates diffractive W-boson Signal: 68 of 8724 events in (0,0) bin DØ Preliminary
W Event Characteristics Standard W Events Diffractive W Candidates Electron ET ET=35.16 Neutrino ET ET=36.08 ET=37.12 MT=70.64 Transverse Mass MT=70.71 ET=35.27 DØ Preliminary
W/ZData Results *Observed clear Diffractive W and Diffractive Z signals *Measured Diffractive W/All W and Diffractive Z/All Z Sample Diffractive Probability Background All Fluctuates to Data Central W (1.08 + 0.19 - 0.17)% 1 x 10-147.7s Forward W (0.64 + 0.18 - 0.16)% 6 x 10-85.3s All W (0.89 + 0.19 – 0.17)% 3 x 10-147.7s Z (1.44 + 0.61 - 0.53)% 5 x 10-64.4s DØ Preliminary
Rate Comparison Correct MC for gap efficiency 20-30% for quark and hard gluon (soft gluon fractions <0.02%) FINAL GAP FRACTION Sample DataQuark Hard Gluon Cen W(1.08 + 0.21 - 0.19)%(4.1 0.8)%(0.15 0.02)% For W (0.64 + 0.19 - 0.16)%(7.2 1.3)% (0.25 0.04)% Z (1.44 + 0.62 - 0.54)%(3.8 0.7)% (0.16 0.02)% NOTE: Observe well-known normalization problem for all structure functions, also different dependence on h for data and MC, as in dijet case DØ Preliminary
Double Gaps at 1800 GeV|Jet h| < 1.0, ET>15 GeV Gap Region 2.5<|h|<5.2 Demand gap on one side, measure multiplicity on opposite side DØ Preliminary
Double Gaps at 630 GeV|Jet h| < 1.0, ET>12 GeV Gap Region 2.5<|h|<5.2 Demand gap on one side, measure multiplicity on opposite side DØ Preliminary
Tevatron Summary • Measurements at two CM energies with same detector adds critical new information for examining pomeron puzzle • The higher rates at 630 were not widely predicted before the measurements • Pioneering work in Central Rapidity Gaps • Modifications to theory based on data have occured • Hard Single Diffraction • Many processes observed and studied including Diffractive W (diffraction is not low pT process) • Discrepancy in shape and normalization of distribution confirms factorization breakdown • Results imply a non-pomeron based model should be considered • Hard Double Pomeron • Observation of interesting new process • Confirms factorization breakdown
Conclusion • Diffraction is a complex subject! • Much new experimental and theoretical work with promise of new more precise data to aid understanding Many open questions: • Are the hard and soft Pomeron distinct objects? • How to combine perturbative and non-perturbative concepts? • How to extract unique parton distribution densities from HERA and Tevatron data? • How to understand gap survival probability? • Is there a particle-like pomeron?