Download

1 / 19
220 likes | 433 Views
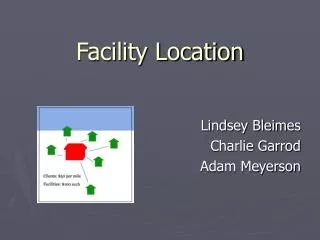
Service Facility Location. Learning Objectives. Discuss the competitive role of service facility location on internal and external customers. Discuss how different customer service criteria affect facility location. Locate a single facility using the cross-median approach.

E N D
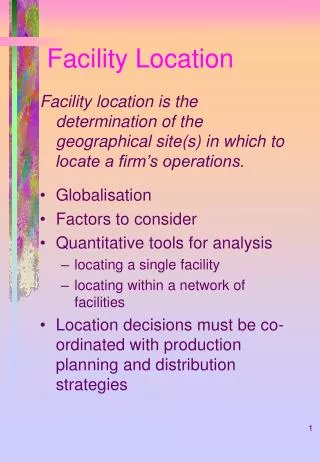
Learning Objectives • Discuss the competitive role of service facility location on internal and external customers. • Discuss how different customer service criteria affect facility location. • Locate a single facility using the cross-median approach. • Use the Huff model to evaluate the economic feasibility of a retail service location. • Discuss nontraditional location strategies.
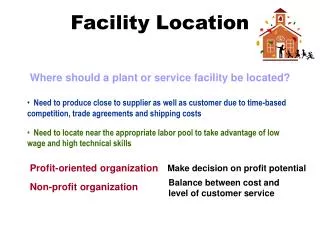
Service Facility Location Planning • Competitive positioning: prime location can be barrier to entry. • Demand management: diverse set of market generators. • Flexibility: plan for future economic changes and portfolio effect. • Expansion strategy: contiguous, regional followed by “fill-in,” or concentrated.
Geographic Representation Location on a Plane Y Destination j YjEuclidean Origin i Yi Metropolitan 0 X Xi Xj
Effect of Optimization Criteria City A 1. Maximize Utilization (City C: elderly find distance a barrier)2. Minimize Distance per Capita (City B: centrally located)3. Minimize Distance per Visit (City A: many frequent users) 3 * 2 -10 -5 5 10 15 * -15 -10 -5 5 10 15 20 25 * City C City B 1
Estimation of Geographic Demand • Define the Target Market(Families receiving AFDC) • Select a Unit of Area (Census track, ZIP code) • Estimate Geographic Demand (Regression analysis) • Map Geographic Demand (3D visual depiction)
Site Selection Considerations 1. Access: 4. Parking: Convenient to freeway exit and Adequate off-street parking entrance ramps 5. Expansion: Served by public transportation Room for expansion 2. Visibility: 6. Environment: Set back from street Immediate surroundings should Sign placement complement the service 3. Traffic: 7. Competition: Traffic volume on street that may Location of competitors Indicate potential impulse buying 8. Government: Traffic congestion that could be a Zoning restrictions hindrance (e.g.., fire stations) Taxes
Breaking the Rules • Competitive Clustering (Among Competitors) (e.g. Auto Dealers, Motels) • Saturation Marketing (Same Firm) (e.g. An Bon Pain, Ice Cream Vendors) • Marketing Intermediaries (e.g. Credit Cards, HMO) • Substitute Electronic Media for Transportation (e.g. telecommuting, e-Commerce)
Single Facility Location Using Cross Median Approach 3 (W3=3) Median =16/2 =8 2 (W2=1) 1 (W1=7) 4 (W4=5)
Huff Retail Location Model First,a gravity analogy is used to estimate attractiveness of store j for customers in area i. Aij= Attraction to store j for customers in area i Sj = Size of the store (e.g. square feet) Tij= Travel time from area i to store j lambda = Parameter reflecting propensity to travel
Huff Retail Location Model Second, to account for competitors we calculate the probability that customers from area i will visit a particular store j.
Huff Retail Location Model Third, annual customer expendituresfor item kat store j can now be calculated. Pij = Probability customers from area i travel to store j Ci = Number of customers in area i (e.g. census track) Bik = Annual budget for product k for customers in area i m = Number of customer areas in the market region
Huff Retail Location Model Fourth, market share of product k purchased at store j can now be calculated.
Athol Furniture Site Alternatives 4 State Park 1 2 3 A 5 Bluff lake 7 Z 6 9 Railroad Freeway Major street Park boundary River Census block group Existing retail outlets Potential sites B 8 Y 11 4 10 12 X
Athol Furniture Data COMPETITORS’ STORE SIZES MAXIMUM SIZE LIMIT OF SITES Store Sales area, sq ft Site Maximum sales area, sq ft A 10,000 X 15,000 B 15,000 Y 20,000 Z 10,000 MINIMUM TRAVEL TIME BETWEEN POTENTIAL AND EXISTING SITES AND BLOCK GROUPS, Min Census block group Site 1 2 3 4 5 6 7 8 9 10 11 12 A 7 5 5 9 1 3 4 5 7 10 14 17 B 10 8 8 10 7 3 3 2 1 2 2 5 X 16 14 14 16 13 8 7 6 4 4 2 2 Y 12 10 10 12 9 5 4 3 2 4 2 5 Z 7 5 5 7 4 2 1 4 3 10 10 13 RELATIONSHIP OF STORE SIZE TO MARGIN ON SALES, EXPENSES, AND NET OPERATING PROFIT AS % OF SALES Sales area, Margin Net operating profit sq ft on sales Expenses before taxes 10,000 16.2 12.3 3.9 15,000 15.6 12.0 3.6 20,000 14.7 11.8 2.0
Athol Furniture Demographics MARKET DATA Census block Number of Average annual Average annual furniture group households income expenditures per household 1 730 $12,000-$12,500 $180 2 1130 8,500-9,000 125 3 1035 19,500-20,000 280 4 635 25,000-over 350 5 160 4,500-5,000 75 6 105 4,000-4,500 50 7 125 4,000-4,500 60 8 470 8,000-8,500 115 9 305 6,000-6,500 90 10 1755 18,500-19,000 265 11 900 15,000-15,500 215 12 290 25,000-over 370 7640