Download
1 / 24
240 likes | 423 Views
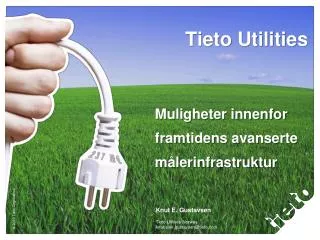
Tieto Utilities. Muligheter innenfor framtidens avanserte målerinfrastruktur. 237 M€. Knut E. Gustavsen Tieto Utilities Norway knut.eirik.gustavsen@tieto.com. „El Dorado for Service Providers“*. source: Der Spiegel. € 25 Bln. € 53 Bln.

E N D
Tieto Utilities Muligheter innenfor framtidens avanserte målerinfrastruktur 237 M€ Knut E. Gustavsen Tieto Utilities Norway knut.eirik.gustavsen@tieto.com
„El Dorado for Service Providers“* source: Der Spiegel € 25 Bln € 53 Bln expected global spending for IT in Energy in 2020. The annual growth rate will be 14-21%* of savings can be unlocked by implementing a 100% smart meter coverage in the EU >60% source: McKinsey 1.000.000+ >30 Mio source: The Brattle Group of consumers in the US and UK are willing to pay for a home monitoring service have been rolled out in Europe so far. Nearly all meters in operation have have involved a Tieto assignment. is the amount of meters that Tieto has taken from roll-out to operation. 10 times increase in supplier switches source: Intamac source: CRE French Regulator 246 Mio average increase in energy efficiency for end consumers in Finland enabled by AMI alone 7% electricity smart meters installed and operated in the EU by 2022 source: Berg Insight source: european commission
Market Development Meter implementation diagram by Ovum, November 2009
Some Tieto facts… Tieto contributed to the roll-out of more than 1.000.000 smart meters. Every 3rd electricity customer in Norway, Sweden and Finland get their bill via Tieto applications. Tieto is the #1 player in Customer Information System in Nordic countries.
Everyone wants to get paid!Introduction of mobility and an increased numberof actors in will require new and complex service provisioning, revenue management and payment solutions. Implicationson Energy Utilities The market willevolve much fasterthan before which requires a more agile and flexible support from IT- architectureand platforms to enable changes. Empowered customers Intensified interactions through new interfaces and channels. Beat them or join them! Independent 3rd party service providers will enter the market. Real-time systemsUtilities will need to change their Batch-based systems to as Telecom did.
-1930 2010 2015 2020 2030+ Traditional “One way delivery” Demand Response “Efficient markets” AMI “Bi-directional communication“ Smart grid “Smart Bi-directional delivery” • Elastic pricing • Reducing peaks • Reducing CO2 in generation • Resizing distribution capacity • Manual meter readings • Manual processes • Overcapacity in grid / generation • Reducing operational costs • Automated processes • Billing on actual consumption • Automation / Self-healing • De-centralizing storage • Distributed generation • Mobility / Electronic cars • New payment solutions Generation capabilities Legislation is mandating and technology is enabling Climate package 20/20/20 by 2020 is the main driver Traditional services / Estimated billing Utility company Traditional System Automation Real-time Billing Complex Solutions Knowledge / Control of consumption Price signals Energy Market Lower consumption / New pricing products Customer Distributed generation / E-mobility Price Signal Price Signal Price Signal Consumption demand Energy Storage Energy Storage Smart meters Smart meters Traditional meters Traditional meters Traditional meters Traditional meters Micro generation Electronic cars Real-time changing consumption patterns
Mediation Solution for Telecom Mediation Solution for Utilities “ Real-time data management enables complex Telecom Services ” “ Real-time data management enables future Utility Services ” Telecom Services Utility Services Mediation Solution Processing Services Calls / Data Demand Response UDR CDR UDR CDR CDR UDR Roaming E-Mobility Roaming Traditional service Traditional service Mobile IP services Pre-Payment Pre-Payment Charging / Billing • Real-time data management • Collection and validation • Filtering out billing-relevant • Aggregation of data • Change format of data • Dispatch data Mobile service Electric car Fraud Detection Fraud Detection Traffic Monitoring Grid Monitoring Analyzing Revenue Assurance Complex Trading Distributed generation Capacity of millions CDR transactions / minute Need of X million UDR transactions / minute? CDR, Call Detail Record UDR, Usage Detail Record
What are the new services that the Energy Utility are supposed to deliver? Charging stationsfor electrical vehicles “Smart home” The question is rather “How can Energy Utilities enable these andother services securing a peace of the cake?” Complex Energy products Feed in energyproducts and tariffs Composite energy productsof electricity, heat and/or gas Time-of-use tariffs Pre payment Broadband Load control Home security Online reporting
New service & financial value chain Close to real time service interface including instant data feeds could be connected to aggregators services, social media and mobile apps. Serv. A Serv. B Aggregators Serv. … Retail Distribution Data Customer Invoice Energy Contract Contract Data Mediation Meter Real time charging € € € Mediation Real time charging
Towards real time charging& monthly invoicing AMI M2C value chain Serv. A Head end EDM CIS Serv. B Customer Serv. … Meter Customer Meter Everynight/week/month Everymonth Billing &invoicing Everymonth/quarter Aggregator Demand response & SmartGrid M2C value chain Charging Invoice Invoice Volatilepricelist Mediation CIS ChargedEDM Everyhour/15min Everymonth Invoicing Everymonth/quarter Real time processes
The future is here… now • In January 2012 Vattenfall Finland will measure 100% of their370 000 meters by the hour. • Consumers will be able to monitor consumption via web-based online reporting services.
Smart City Stockholm Royal Seaport
Smart City elements • Office buildings have a huge potential to save or to produce energy when planning a new or renovating a building • Government/municipal buildings are always cutting in the budget for building management. The old janitor role is gone and the new service companies do not have incentives to save money for a building • Residential homes (our private homes) also have a huge potential to reduce our energy consumption. But price incentives has not been there, until this winter when the electricity price became very high. • Street lighting is also consuming a lot of energy that can be preserved better • Industry in general has a large potential for both saving and producing energy, and will be an important player in a micro grid
Smart grids Smart metering is just the 1st step to…
Smart meteringLowers operational costs by process automation • The Advanced Metering Infrastructure has now been established in Sweden and at selected other Utilities in the Nordics(like Vattenfall in Finland). • A number of customer services processes have been fully or partly automated which has led to initial savings in operational costs – often more than 20%. Potential is of course much bigger than that. • Customer requests like Move outs, Move ins and Supplier switches are today fully automated in some Utilities if the customers are served via the web. • Often also field force operations have been much better integrated to customer service thanks to investments done in IT infrastructure during the Roll Outs which also have a positive effect on operational costs, quality of service and lead time of field force work orders.
EU regulation pushes Smart grids • In December 2008 EU decided on the “Green package” – 20/20/20 by 2020. It means that the EU member states shall by 2020 • Reduce green house gases by 20% • Increase renewable energy to 20% of energy mix • Increase energy efficiency with 20% • In June 2009 the 3rd Gas & electricity directive was ratified that is demanding all member states to have 80% smart meters by 2020. Definition of the smart meter is ongoing on EU level but we can expect that it shall be able to read meters by the hour to enable demand response. • There exist a task force in EU that analyzes some aspects of smart grids and expected development in the area. Many expects a 4th directive that will enforce implementation of Smart grids in order to secure increased development of renewable generation and charging facilities for electricity cars.
Increased in-feed of renewable generation into different levels of the grid • Installation and utilization of decentral storage units in the distribution grid • Steering and optimization of consumption via price signals (demand response) • Mobile delivery points and roaming driven by charging facilities for electric cars Next generationenergy system “Intelligent grid initiatives are shifting focus from delivery infrastructures to consumers.” Gartner, 2009 • It will mean a need of new payment solutions that requires real time rating & charging as well as household that can generate energy. • It will also mean new possibilitiesand touch points to customers inevery day life
Knut E. Gustavsen Tieto Utilities Norway knut.eirik.gustavsen@tieto.com
In-house, 100% Minimum, 81% Best-case, 34% Characteristics of the Cloud Multi tenancy Scalable on demand inalmost real time Pay as you use Share delivery technology Consume as Self-service Delivered as a Service Service cost reduction of 19-66% Based on costs of staff, client software, filtering, archiving, storage, server software, server hardware and operating system [Forrester 2009]
Different Cloud Service Models Where Tieto can add value Process DigitalisedProcess Customer responsibility Application Application Supplierresponsibility Platform Platform Infrastructure PaaS Platform as a Service SaaS Software as a Service DPaaS Process as a Service IaaS Infrastructure as a Service Will be global commodities 23
Tieto’s value proposition Enable cost efficient operation and next generation services for Energy utilities by digitalizing the M2C value chain Optimizing and automating the M2C business processes Empowering end-customers and employees through digital services by Turning our knowledge and passion into sustainable results enabling our customers to face the new Digital reality