Download

1 / 9
90 likes | 172 Views
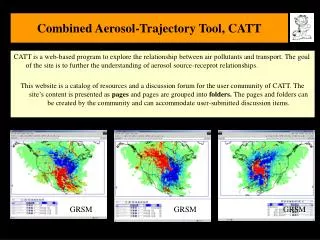
CATT HELP BOOK. CATT Screen Layout and User Interface. The CATT program interface consists of two frames: Top Frame: Map consisting of super positioned data layers Bottom Frame: list of data layers and other tools for rendering and filtering data. Overview of CATT controls.

E N D
CATT Screen Layout and User Interface • The CATT program interface consists of two frames: • Top Frame: Map consisting of super positioned data layers • Bottom Frame: list of data layers and other tools for rendering and filtering data
Overview of CATT controls • The top row controls opening new files and manipulating the map frame • Open data layers that make up the map are controlled below
Location Selection • The data layers are linked such that when a new site is selected the other layers update automatically • A new site can be selected by knowing the location code or name • Clicking the map on the desired location will also change the location
Filters: Parameters, Time Range and Date • Chemical parameter filter:restricts trajectories to days when chemical filter is satisfied • Time range for aggregation:default is 1988-2000; To restrict time range you must change it in ATAD_Grid1 and ATAD_Grid2 • Months of aggregation: default performed on all months; To restrict uncheck boxes for months not wanted
Transport Metric Selection • Currently, there is a choice of two different transport probability metrics: • Incremental Residence Time Probability (IRTP) proposed by Poirot et al., 2001 is the difference between the chemically filtered and unfiltered residence time probalbilities. Positive values of IRTP in a grid indicates more than average liekihood of transport; (red); negative IRTP values (blue) represent less than average likeihood of transport. • Potential Source Contribution Function (PSCF) proposed by Hopke et al., 19?? is computed as the ratio of the filtered and unfiltered residence time probabilities. Higher values of PSCF is indicative of inreased source contribution. • The desired metric is selected through a dialog box invoked by clicking on the right-most button in the TRAJ_CHEM layer.
Map Navigation • The map display can be adjusted by using pan, zoom, and layer ordering tools
Rendering Options • Coloring scheme uses rainbow • Blue=low Red=high • This is adjusted by clicking “Render” button
File Menu and Data Export • Save Current Page: • In pull down file menu (below map) select “Save Page” • Enter a filename in dialog box • Press “Save page as” • Open saved page: • In file menu select “Open page” • Select desired file • Note: initial loading takes up to 90 seconds • The reload button will turn red any time changes are made- when this happens click and the map will refresh