Download
1 / 17
170 likes | 279 Views
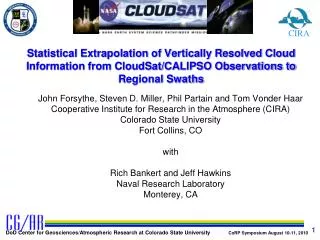
CIRA. Statistical Extrapolation of Vertically Resolved Cloud Information from CloudSat/CALIPSO Observations to Regional Swaths. John Forsythe, Steven D. Miller, Phil Partain and Tom Vonder Haar Cooperative Institute for Research in the Atmosphere (CIRA) Colorado State University

E N D
CIRA Statistical Extrapolation of Vertically Resolved Cloud Information from CloudSat/CALIPSO Observations to Regional Swaths John Forsythe, Steven D. Miller, Phil Partain and Tom Vonder Haar Cooperative Institute for Research in the Atmosphere (CIRA) Colorado State University Fort Collins, CO with Rich Bankert and Jeff Hawkins Naval Research Laboratory Monterey, CA
CloudSat (cloud radar) and CALIPSO (cloud lidar) have been providing vertical cloud profiles at ~ 1.1 km horizontal and 240 m vertical resolution since 2006. Hypothesis • Certain kinds of clouds form under characteristic environmental conditions of temperature, moisture, stability, etc., that occur over regional/synoptic scales. • Local observations of clouds occurring within that regional/synoptic-scale environment may provide useful information about the surrounding cloud field. CIRA Research Questions • To what extent do limited (but detailed) observations of cloud vertical structure (water content) and geometric boundaries (top/base) relate to surrounding clouds? • Can this concept be applied to ‘vertical-slice’ observations from active sensors (radar/lidar) to augment the information provided from passive sensor 2-D imagery? Can we use sparse cloud observations to create local 3-D cloud scenes?
Relevance CIRA • Cloud base estimation in data void regions • UAV operations (visibility / icing) • Model evaluation (e.g. scene contributions to the NCAR Model Evaluation Tool) • Representativeness of data near taken CloudSat/CALIPSO track (like in a field experiment)
Opaque Ice cloud Target is under a Cirrus cloud, use these observations Water cloud Current Dilemma: Given sparse ceiling observations, how to determine the ceiling over a data-void region? Average the observations? Be cautious and use the lowest value? Use the nearest observation? x 3000’ x 30000’ x x 30000’ 100 km (notional) 10000’
Visible / Infrared Cloud Typing to Provide Spatial Context CIRA • GSIP (GOES Surface and Insolation Product) Cloud Classification (applied to MODIS channels used here): • A 5-channel (0.65, 3.9, 6.7, 11, 12-13 µm) physically-based pixel-level cloud classification with heritage from AVHRR and GOES (Pavolonis and Heidinger, 2005). These are the baseline channels for most contemporary geostationary meteorological satellites. • Additional published spectral tests using MODIS 1.38 and1.61 µm channels added.
MODIS-derived cloud type provides spatial context. The GSIP classifier (Pavolonis and Heidinger, 2005)) shown for Typhoon Choi-wan case, September 15, 2009. CIRA CloudSat Track 5 channel MODIS GSIP (“GOES Imager-like”) 5 channel MODIS GSIP + 1.38 µm and synthesized 1.61 µm
Question: What is the cloud vertical structure away from the curtain? Typhoon Choi-wan MODIS Visible (view from east) with CloudSat / CALIPSO curtain overlaid in colors of MODIS cloud type. 10 km 0 km 10 km 0 km September 15, 2009
Brief Review of Method to Gather Cloud Type Spatial Statistics
Cumulus Cirrus Top Top Base Base 1) Form Geometric “Traces” CIRA Orbital sub-segment example • Used Cloud Scenario Classification to compute departures in base/top height for contiguous cloud layers of a given cloud type, traced from a reference point.
2) Composite these Traces CIRA > 3 E+08 cloud layer samples
Cloud Base 3) Compute Statistics on the Composites of Traces CIRA Cloud Top Statistics also collected by region, season and surface type Distance (km)
The Application Concept CIRA Cloud Type & Top Height: Retrieved Liquid Water Path (LWP): Retrieved 1) Estimate the cloud base height: 2) Distribute LWP between cloud Top and Base according to cloud type: CIRRUS STRATOCUMULUS CUMULUS
Taking the Next Steps Towards 3-D Cloud Fields – Behavior of the GSIP Classifier
# of cloud layers (GEOPROF_LIDAR) by GSIP MODIS class. January 20, 2009. Daylight granules equatorward of 50° From MODIS cloud mask Good news, supposed to be multilayer Deep clouds Where Modis Cloud Mask says cloudy, a cloud layer is almost always present (i.e. Number of Layers > 0)
# of cloud layers (GEOPROF_LIDAR) by GSIP MODIS class. January 20, 2009. Daylight granules equatorward of 50° 5 channel classification 5 channel + 1.38 and 1.61 µm tests More Overlap Generated
Aggregated cloud thickness (m) by GSIP MODIS class. January 20, 2009. Daylight granules equatorward of 50° 5-channel classification Partly Cloudy Liquid Supercooled clear Missed clouds are thin Perhaps the most variable class Opaque Ice Cirrus Overlap Lower cloud masked Very similar to Glaciated class Almost always > 5 km thick “true” cirrus
Summary CIRA • A technique for providing vertically-resolved cloud information for the top-most layer(s) of passive imager swath data, based on cloud type dependent statistics from CloudSat/CALIPSO, has shown some skill. • Early results show skill in prediction of cloud ceilings when applying the correlative approach and constraining cloud type. • As the active datasets continue to grow, statistics for the stratified datasets will become increasingly robust.