Graphing Quadratic Functions – Concept
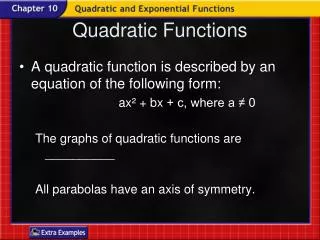
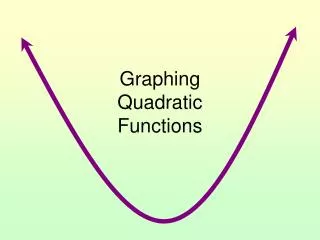
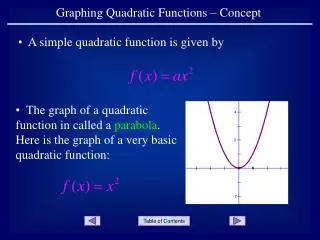
Graphing Quadratic Functions – Concept. A simple quadratic function is given by. The graph of a quadratic function in called a parabola . Here is the graph of a very basic quadratic function:. The value of the coefficient a determines the direction the parabola faces.

Graphing Quadratic Functions – Concept
E N D
Presentation Transcript
Graphing Quadratic Functions – Concept • A simple quadratic function is given by • The graph of a quadratic function in called a parabola. Here is the graph of a very basic quadratic function:
The value of the coefficient adetermines the direction the parabola faces. • When a is positive, the parabola faces up. • When a is negative, the parabola faces down.
Example 1 Face Down Face Up
Vertex • The vertex of a parabola is the lowest point (minimum y-value) on the graph of a parabola … … or the highest point (maximum y-value) on the graph. Maximum Minimum
The axis of symmetry of a parabola is the vertical line going through the vertex. • Example 2 Draw the axis through the vertex. Notice the symmetry of the two branches of the parabola about the axis.
The equation of the axis of symmetry is given by In this case, the equation of the axis of symmetry is given by:
When graphing quadratic functions, it can be helpful to plot all intercepts. x-intercepts y-intercepts Set y = f (x)= 0 and solve for x. Set x =0 and solve for y. This is where the graph intersects the x-axis. This is where the graph intersectsthe y-axis.
x-intercepts y-intercept • Example 3
Face Down Face Up • Axis of symmetry: x-int: y = f (x)= 0 and solve for x. y-int: x =0 and solve for y. SUMMARY Graphs of Quadratic Functions • The graph of a quadratic function in called a parabola. • The maximum or minimum y-value of a quadratic occurs at the vertex.
END OF PRESENTATION Click to rerun the slideshow.