Download
1 / 9
90 likes | 154 Views
Uses for Data. Part of the M&E Plan. Data Use. Who is using data?. Who is happy?. How C an W e Use D ata?. To know if we are meeting targets. To make decisions about programs and policies. To prioritize activities. To identify support/supervision needs.

E N D
Data Use Who is using data? Who is happy?
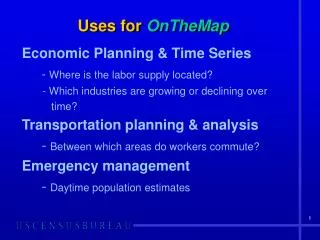
How Can We Use Data? • To know if we are meeting targets. • To make decisions about programs and policies. • To prioritize activities. • To identify support/supervision needs. • To report back to donors (get more funding!).
What Data Do OTHERS Need? • NTP Treatment completion, reduced morbidity. • Donor Feasibility: Will it work? • Vendors # recruited, impact on business. • Politicians Will it save money? Foreign donor gives us pilot money to train local market vendors to be DOTS observers.
Data Stakeholders • NTP staff • Other NTPs • Community-based org. • Faith-based org. • Int’l/National NGOs • Health profession groups • Medical centers, clinic administrators • Law/Policymakers • TV, radio, print media • Evaluators, researchers • Donors • Partner organizations • TB clients • The public • Our own staff/volunteers
Importance of Feedback Data should not flow in just one direction! National Program Regional Office Facility Manager DOTS Nurse
Reporting Data • Think about your audience! • What do they know about the program? • What do they know about ACSM and TB? • How can you “interpret” the data for them? • What are the most important trends? • More data are not always better! • What is the best way to report the data? • Narratives, in person, newsletters, online, charts/graphs/tables.
Interpreting Data: Example • What do these numbers tell you? • The volunteers in District E are superstars! • Volunteer problems in Districts C and D? • Why such wide variability in smear positivity (2% to 15%)?