UNIT 2 NATURAL RESOURCES
UNIT 2 NATURAL RESOURCES. Structure of Natural Resources and it’s Usefulness. Natural Resources. Abiotic (Air, Water, Minerals etc.). Biotic (Plant & Animal Species). Ecosystem. Event. Time Line. Birth of Earth. 4600 m.y. ago. Earliest Cells. 3600 m.y. ago. First Algae.

UNIT 2 NATURAL RESOURCES
E N D
Presentation Transcript
UNIT 2 NATURAL RESOURCES
Structure of Natural Resources and it’s Usefulness Natural Resources Abiotic (Air, Water, Minerals etc.) Biotic (Plant & Animal Species) Ecosystem
Event Time Line Birth of Earth 4600 m.y. ago Earliest Cells 3600 m.y. ago First Algae 1200 m.y. ago Explosion of Algae & Marine forms 560 m.y. ago First Fish 488 m.y. ago Natural Ecological Changes Reptiles & Conifers 359 m.y. ago Mamals & Dinosaurs 251 m.y. ago Whales & Horses 55.8 m.y. ago Grasses 33.9 m.y. ago Forests 23 m.y. ago Glaciers 1.8 m.y. ago Humans (Hunters) 11,500 years ago History of Our Global Environment and Changes in Land and Resource Use
Development Material Resource Financial Resource Artificial (Man Made) Natural Why to bother about natural resources? Natural Resource to Artificial Material Resources & Financial resource is One Way Traffic !! Is that a Big Problem ??
Natural Resources and Associated Problems Unequal Consumption • A major part of natural resources consumed in the ‘developed’ world. • The ‘developing nations’ also over use many resources because of their greater human population. • However, the consumption of resources per capita (per individual) of the developed countries is up to 50 times greater than in most developing countries.
Advanced countries produce over 75% of global industrial waste and greenhouse gases. • Energy from fossil fuels consumed in relatively much greater quantities in developed countries. • Their per capita consumption of food too is much greater as well as their waste The USA for example with just 4% of the world’s population consumes about 25% of the world’s resources. • Producing animal food for human consumption requires more land than growing crops. Thus countries that are highly dependent on non-vegetarian diets need much larger areas for pastureland than those where the people are mainly vegetarian.
The Need for Sustainable Lifestyles The quality of human life and the quality of ecosystems on earth are indicators of the sustainable use of resources. There are clear indicators of sustainable lifestyles in human life. • Increased longevity • An increase in knowledge • An enhancement of income. • These three together are known as the ‘human development index’. The quality of the ecosystems have indicators that are more difficult to assess. • A stabilized population. • The long term conservation of biodiversity. • The careful long-term use of natural resources. • The prevention of degradation and pollution of the environment.
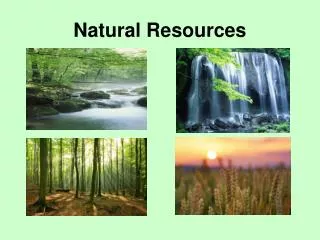
Earth’s Resources and theirImportance • Atmosphere • Hydrosphere • Lithosphere • Biosphere
Atmosphere • Provides oxygen for life on earth. • Troposhere is a natural thermostat. Balances the temperature to a level which is conducive for survival of life on earth. • Troposphere is lower portion of atmosphere, extending upto about 8 km at poles and 16 km at the equator. • It is about 3/4th of atmospheric mass and is abode of clouds, storms and convective motion. • Troposhere is a natural thermostat. • This layer is of greatest in pollution control since this is the layer in which most living things exists. • One of the most recent changes in troposphere knows the phenomenon of acid rains. • StratosphereIt is 50 km in thickness, has ozone layer which is protective shield against ultraviolet rays and Sulphate layer which is responsible for formation of rain.and contains a large number of Sulphates which are important formation of rains.
Hydrosphere • The hydrosphere consists of oceans, seas, rivers, glaciers, lakes, reservoirs, etc., • Provides fresh water for life sustenance and agriculture. • Hydrosphere covers 3/4th of the earth’s surface. Major part of is marine ecosystem as ocean and only small part is fresh water. Lithosphere • Lithosphere is the top crust of the earth on which the continents and ocean basins rest. • The lithosphere is the soil mantle in which biological activities takes place. • The lithosphere plays an important role as it not only produces food for human beings and animals, but also the decomposition of organic waste is carried out by host of microorganisms in soil. • Soil ecology provides fertile soil for agriculture • Storehouse of Minerals, Fossil fuels.
Biosphere • Provides Food for all Biotic interdependent species. • Source of energy. • Source for Variety of bio-products useful for human life like Medicinal plants and Organisms. • Very important for maintaining balance of Ecosystem.
Natural Cycles Between the Sphere • All four spheres are closely inter-linked systems and are dependent on the integrity of each other BIOGEOCHEMICAL CYCLES • Biogeochemical cycles include oxygen, carbon, nitrogen and sulfur cycles.
Resources • It means a source of supply/support i.e, generally held in reserve natural means, an ecosystem not influenced by man • It means that reserve stock of supply which living things can take from nature for sustainance of life.
Natural Resources • The natural reserve stock/ supply which man utilizes for sustainance and welfare. • Natural resources are of two types a) Renewable b) Non-renewable
Natural Resources Definition: variety of goods and services provided by nature which are necessary for our day-to-day lives • Plants, animals and microbes (living or biotic part) • Air, water, soil, minerals, climate and solar energy (non-living or abiotic part)
DEFINITION • Natural Resource ( NR) is defined as a form of energy and/or matter which is essential for the functioning of organisms, population and ecosystem. • NR is essential for the fulfillment of • physiological, • social, • economical and • cultural needs at the individual and community levels.
Renewable and Non-Renewable Resources • Renewable resources Natural resources which can be used but can be regenerated by natural processes, provided if there is no intervention in natural regeneration cycle. Example: Water, Wood • Non Renewable Resources Those which will be exhausted in the future if we continue to extract these without a thought for subsequent generations. Example: Minerals, Fossil fuels.
What Will Be Discussed In This Unit?Types of Resources • Forest Resource • Water Resource • Land Resource • Mineral Resource • Food Resource • Energy Resource
Forest Resources • derived from latin word ‘foris’ • A forest can be defined as a biotic community predominant of trees, shrubs or any other woody vegetation usually in a closed canopy.
Necessity of the resource in maintaining ecological balance/sustained development • Functions of the resource • Degradation of the resource • Conservation of the resource • Govt role • People’s participation
India’s Forest Cover : 6,76,000 sq.km. (20.55% of geographic area) • Dense Forests : 4,17,000 sq.km. • Open Forests : 2,59,000 sq.km. • Mangroves ; 4,490 sq.km. • Madhya Pradesh- 77,265 sq.km. (11.5%) • Arunachal Pradesh – 68,045 sq.km. (10%) • Chattisgarh – 56,448 sq.km. (8.4%)
TYPE OF FORESTS • Are determined by temperature &rainfall. • Tropical forests • Temperate forests • Savanna grassland • Coniferous forests • Tundra forests
Type Percentage (%) Location Tropical moist deciduous 37 Andamans, U.P., Madhya Pradesh, Gujarath, Maharastra, Karnataka, Kerala Tropical dry deciduous 28 North strip of Himalayas, South strip of Kanyakumari Tropical dry evergreen 8 Western ghats, Andamans, Assam Subtropical pine 7 Himalayas Others 20 Distribution of Indian Forests by Type
WHY ARE THEY IMPORTANT? Play a very crucial role in every nation’s economical, social and cultural activities . Many river systems originate in forests and anchor rich biodiversity. Forests provide timber and many non-timber products to the local communities and national economy.
In India more than 2,00,000 villages are located in the fringe of forests. More than 20 crore people (including 7 crore tribals) depend on forests for their livelihood. About 3 crore people are directly involved in gathering & trading non-timber forest products like fruits, seeds, flowers, leaves, honey, lac, gum etc. Any impact on forest vegetation & biodiversity will have adverse implications for livelihood of forest-dependent communities.
Forest Functions I. Protective And Ameliorative Functions. II. Productive Functions • Recreational And Educational Functions IV. Development Functions
I. Protective and ameliorative functions. • Water shed protection • Reducing the rate of surface run-off of water • Preventing flash floods and soil erosion • Producing prolonged gradual run-off and thus safeguarding against drought. • Erosion control • Holding soil (by preventing rain from from directly washing soil away) • Land bank • Maintaining soil nutrients and structure. • Atmospheric regulation • Absorption of solar heat during evapotranspiration • Maintaining carbon dioxide levels for plant growth • Maintaining the local climatic conditions
II. Productive Functions • Local use – Consumption of forest produce by local people who collect it for subsistence • Food • Fodder for cattle • Fuel wood and charcoal for cooking and heating • Poles for building homes in rural and wilderness areas • Timber for house hold articles and construction • Fiber for weaving baskets, ropes, nets, strings, etc., • Sericulture for silk • Apiculture for rearing bees for honey (bees as pollinators) • Medicinal plants for traditional medicines, investigating them as potential source for new modern drugs
Market use • Most of the products used for consumptive purposes and good source of income for supporting their livelihood • Minor forest products (NTFPs): Fuel wood, fruits, gum, fiber, etc are source of income for forest dwellers • Timber extraction for construction, industrial uses, paper pulp etc
Recreational And Educational Functions IV. Development Functions • Employment functions • Revenue
Ecological significance of forests • Balances CO2 and O2 levels in atmosphere. • Regulates earth temp and hydrological cycle • encourage seepage and reduces runoff losses, prevents drought • Reduces soil erosion (roots binding), prevents siltation and landslides thereby floods • Litter helps maintaining soil fertility • Safe habitat for birds, wild animals and organisms against wind, solar radiation and rain
Deforestation • British times • early period following independence -
CAUSES OF DEFORESTATION • Broadly –agric, logging, cash crop economy, mining and dams • Increase in population • Urbanization & industrialization • Mineral exploration • Construction of dam reservoirs • Infrastructure development • Over grazing & Forest fires • Human encroachment & exploitation • Pollution-acid rain
HUMAN ACTIVITIES & FORESTS… Clearing and burning of forests for agriculture, cattle raring & timber extraction loss of biodiversity, extinction of species and soil erosion loss of vital top soil and disturbance of carbon cycle leading to global warming. Clearing, cutting & conversion of forest land in hilly region for agriculture and plantations and housing landslides, floods and silting of rivers.
INDUSTRILISATION • How much wood goes in to making paper? • Paper industry – world’s fastest growing consumer of wood. • World wide – 40% and expected to reach 60% by 2050 • US – 30% worlds paper use – consuming a billion trees a year – releasing 100 million tons of toxins every year. • India – 600 paper mills – 8.5 million capacity –39% wood and bamboo, 31% agricultural residue, 30% waste paper.
CONSEQUENCES OF DEFORESTATION • FOOD • ECOLOGICAL BALANCE • INCREASING CO2 • Soil erosion • Destruction of resources • Heavy siltation of dams • Changes in the microclimate • Loss of biodiversity • Destruction of scenic beauty • Environmental pollution