Download
1 / 26
260 likes | 285 Views
This presentation summarizes recent results from the PHOBOS experiment, including charged particle multiplicity, particle ratios, flow measurements, and predictions for future energy collisions. The data was collected from 130 GeV collisions and provides insights into the behavior of high-energy collisions.

E N D
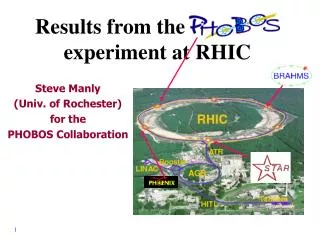
Recent Results fromThe PHOBOS Experiment Russell Betts (UIC) for the PHOBOS Collaboration
ARGONNE NATIONAL LABORATORY BROOKHAVEN NATIONAL LABORATORY INSTITUTE OF NUCLEAR PHYSICS, KRAKOW MASSACHUSETTS INSTITUTE OF TECHNOLOGY NATIONAL CENTRAL UNIVERSITY, TAIWAN UNIVERSITY OF ROCHESTER UNIVERSITY OF ILLINOIS AT CHICAGO UNIVERSITY OF MARYLAND Birger Back, Nigel George, Alan Wuosmaa Mark Baker, Donald Barton, Alan Carroll, Joel Corbo, Stephen Gushue, George Heintzelman, Dale Hicks, Burt Holzman,Robert Pak, Marc Rafelski, Louis Remsberg, Peter Steinberg, Andrei Sukhanov Andrzej Budzanowski, Roman Holynski, Jerzy Michalowski, Andrzej Olszewski, Pawel Sawicki , Marek Stodulski, Adam Trzupek, Barbara Wosiek, Krzysztof Wozniak Wit Busza (Spokesperson),Patrick Decowski, Kristjan Gulbrandsen, Conor Henderson, Jay Kane , Judith Katzy, Piotr Kulinich, Johannes Muelmenstaedt, Heinz Pernegger, Michel Rbeiz, Corey Reed, Christof Roland, Gunther Roland, Leslie Rosenberg, Pradeep Sarin, Stephen Steadman, George Stephans, Gerrit van Nieuwenhuizen, Carla Vale, Robin Verdier, Bernard Wadsworth, Bolek Wyslouch Chia Ming Kuo, Willis Lin, Jaw-Luen Tang Joshua Hamblen , Erik Johnson, Nazim Khan, Steven Manly,Inkyu Park, Wojtek Skulski, Ray Teng, Frank Wolfs Russell Betts, Edmundo Garcia, Clive Halliwell, David Hofman, Richard Hollis, Aneta Iordanova, Wojtek Kucewicz, Don McLeod, Rachid Nouicer, Michael Reuter, Joe Sagerer Richard Bindel, Alice Mignerey The PHOBOS Collaboration
ZDC Paddle Trigger Counter Time of Flight Spectrometer Vertex Octagon Ring Counters y f x q z The PHOBOS Detector (2001) Cerenkov • Completed Spring 2001 • 4p Multiplicity Array • - Octagon, Vertex & Ring Counters • Two Mid-rapidity Spectrometers • TOF wall for High-Momentum PID • Triggering • Scintillator Paddles • Zero Degree Calorimeter 137000 Silicon Pad channels
Summary of PHOBOS Results • Results from CR2000 – Trigger + Partial Si • Charged Particle Multiplicity at 56 and 130 GeV. PRL 85,3100(2000) • Results from PR2000 – Incomplete Second Arm • Particle Ratios. PRL (in press) • Rapidity and Centrality Dependence of Elliptic Flow. • Centrality Dependence of Mid-Rapidity Multiplicity. PRL(submitted) • dN/dh Distributions as a Function of Centrality. PRL (in press) • Results from PR2001 – Complete Detector • Charged Particle Multiplicity at 200 GeV. PRL (submitted)
x z Events Dt (ns) Triggering on Collisions Positive Paddles Negative Paddles ZDC N ZDC P Au Au PN PP Paddle Counter ZDC Counter Valid Collision • Coincidence between Paddle counters at Dt = 0 defines a valid collision. • Paddle + ZDC timing reject background. • Sensitive to 97±3 % of inelastic cross section for Au+Au.
b Central b Trigger Selection - ZDC vs Paddles Peripheral
Particle Ratios at 130 GeV from PHOBOS Spectrometer - PRL (in press) p-/p+ = 1.00 ±0.01 (stat) ± 0.02 (syst) K-/K+ = 0.91 ± 0.07 (stat) ± 0.06 (syst) p/p = 0.60 ± 0.04 (stat) ± 0.06 (syst) K-/K+ vs Energy p/p vs Energy
250 200 150 RHIC quarks-gluons 100 SPS AGS Chemical Temperature Tch [MeV] hadrons 50 SIS 0 0 200 400 600 800 1000 1200 Baryonic Potential B [MeV] Thermal Model of Ratios mB = 45 MeV Assuming T=165 MeV Redlich et al Phase Diagram (N Xu)
|h| < 1.0 sNN=130GeV b V2 Peripheral Collisions Central Collisions SPS 17 GeV PHOBOS Systematic error ~ 0.007 Normalized Paddle Signal (STAR : Normalized Nch ) b Flow from Azimuthal Asymmetry of Octagon Hits @130 GeV Preliminary
Pseudo-Rapidity Dependence of v2 130 GeV Preliminary h Dependence of v2 on h Roughly Follows dN/dh
Measuring Multiplicity • Tracking detectors • Tracklets in Spectrometer • Tracklets in Vertex Detector • Single layer detectors • Count hits above threshold, assume Poisson-statistics • Use deposited energy (dE/dx) in each Si-pad
Tracklets • Tracklet: Two-Hit Combination + Vertex Position • >300 Tracklets/Central Event in Vertex, >100 in Spectrometer Vertex-Detector
-3 0 +3 -5.5 +5.5 Analog and Digital Hit-Counting f h Octagon, Ring and Vertex Detectors (unrolled) Count Hits or Deposited Energy
First Physics Results from RHIC Tracklet Analysis of CR2000 Data PRL 85,3100(2000) Increase over SPS and over pp Data
Dependence of Multiplicity on Centrality at 130 GeV Tracklets – PR2000 Peripheral Collisions Central Collisions Preliminary Yellow band: Systematic uncertainty dNch/dh/(0.5*Npart) } Data } Theory Npart
Shapes of dN/dh Distributions at 130 GeV - Hit Counting • Shapes only weakly dependent on centrality • Differ in details
(0-6%) AMPT (35-45%) (p-p) HIJING Most of “new” behavior is at mid-rapidity – detailed comparison with pp and pA required.
Predictions for ratio of dN/dh between 130 and 200 GeV • Ratio is easier to measure and to calculate. • Predictions range from 1.08 to 1.32
PHOBOS Data Taking in 2001 • Collected ~2000 min bias 130 GeV collisions • Check Detector Calibrations • First 200 GeV collisions seen July 18th • Collected > 1M Events Since. • Data Reconstructed and Analyzed on RCF and “pharm”
Silicon Signals 200 vs 130 GeV Signal shapes are (almost) identical: high occupancy (>70%) low occupancy (<10%) Essential for Hit-Counting; Many Uncertainties Drop Out in Ratio 200/130 GeV
Results for 200 GeV 1.14±0.05 6% Most Central Events - Systematic Uncertainties Only
pp Energy Dependence Logarithmic Dependence ? - Energy Scan Needed.
Ratio 200/130 GeV Ratio 200/130 averaged for four PHOBOS methods Phobos Measurement R200/130 = 1.14 +/- 0.05 Moderate Increase in Energy Density? Systematic Uncertainty
Pseudo-Rapidity Dependence of Ratio 200 GeV Broadening of dN/dh Distribution 130 200 GeV
Summary • Several Results at 56 and 130 GeV • First results from Au+Au at 200 GeV • dN/dh= 650 +/- 35 for 6% most central collisions • dN/dh increases by 1.14+/- 0.05 from 130 GeV to 200 GeV • Moderate increase in energy density • Further constraints for theoretical scenarios • Much more to come !!!