Download
1 / 32
320 likes | 529 Views
TMDL Development for the Floyds Fork Watershed Watershed Hydrology and Water Quality Calibration and Water Quality Model Calibration. Technical Advisory Committee Meeting #2 Louisville, KY September 6 th , 2012. Presenters.

E N D
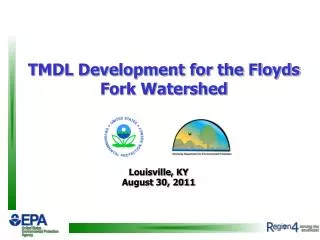
TMDL Development for the Floyds Fork Watershed Watershed Hydrology and Water Quality Calibration and Water Quality Model Calibration Technical Advisory Committee Meeting #2 Louisville, KY September 6th, 2012
Presenters • Tim Wool National TMDL Expert Water Quality Modeler, TOM • Brian Watson Director, Water Resources Group Tetra Tech, Atlanta
Updates Since TAC Meeting #1 • Received more data and incorporated into watershed and instream model • Performed sensitivity analysis on sinkholes • Updated watershed model calibration • Updated watershed modeling report (REV4) • Updated instream model calibration • Updated instream modeling report (REV1)
Summary of Data Sources • KDOW • Lat/Longs for 73 NPDES Facilities and 11 Water Withdrawals • Lat/Longs for 49 Water Quality sites (26 USGS, 11 Currys Fork WBP, 7 MSD, 3 Bullitt WBP, 2 KDOW) • Water Withdrawal Information (Lat/Longs and pumping data) • KDOW Management Decisions Document. This document contained key information about expectations of the TMDL effort. • MS4 Information • Lat/Longs for 33 Assessment Points in watershed • Preliminary information on Water Quality Targets for Floyds Fork watershed • USGS • Flow Data for Period of Record at 7 Stations • Water Quality Chemistry Data for 2007 and 2008 for 26 stations.
Summary of Data Sources • MSD • Information for Weather Stations (TR and RG Stations). • Water Quality Chemistry Data. This includes data for 5 stations for the period of record. • Sonde data at 5 Locations • Floyds Fork Action Plan Update • Septic Tank Shapefile for Floyds Fork Watershed. • Links to key Water Quality Synthesis Reports and other online documents • SSO Information and data • 11 GIS Coverages including contours, Dfirms, etc.
New Data Sources since TAC#1 • Sinkholes • Springs • Land Use Nutrient Application Rates • Corn and Soybean • Golf Courses
Sensitivity Analysis on Sinkholes • Received document on Curry’s Fork watershed • Contacted NRCS for coverage • Performed sensitivity analysis on number of sinkholes • Current dataset has 132 acres (<0.1%) • Increased area by 10x (1,320 acres or <1.0%)
Springs • Received location and flow data from USGS • 20 identified springs • Utilized Kentucky Geologic Survey data for water quality concentrations • Significantly improved hydrology calibration, particularly baseflow numbers
Non-Point Source Application Rates • Corn and Soybean application rates and yields • NRCS • Jefferson and Oldham County • Confirmed rates with Kentucky Corn Growers (August 22, 2012) • Rates much lower than those published in KY tonnage reports • Golf Course application rates • Superintendent of Golf Courses for the Louisville Metro Parks and Recreation Department who manages nine Metro Golf Courses in the Louisville area, two of which lie in the Floyds Fork Watershed. • Incorporated into Grassland landuse.
Water Quality Model • Water Quality Analysis Simulation Program (WASP) • Dynamic Simulation • Full Eutrophication Kinetics • Parameters simulated • DO • BOD • Ammonia • Nitrate-Nitrite • Organic Nitrogen • Organic Phosphorus • Ortho Phosphorus • Chlorophyll a • pH
Linkage to Water Quality Model • Calibrate LSPC Watershed Model • Removed Point Sources, SSO’s, Water Withdrawals, Non-failing septics and Springs from the watershed model • Run watershed model to get Land Use only outputs • Use WRDB to process LSPC outputs into WASP inputs • Processed Point Sources, SSO’s, Water Withdrawals, Non-failing septics, and Springs to be input into WASP • Create WASP input file • Calibrate WASP model
Linkage to Water Quality Model LSPC Land Use Flows and Concentrations PS, SSO WD, NFS, S WASP Met. Data Rates and Constants
WASP Segmentation • Floyds Fork and its tributaries were divided into a series of computational segments. • A BASINS/WASP plug-in user interface was used to carry out the segmentation. Used NHDPlusflowlines. • A maximum and minimum travel time was specified to divide the waterbody into segments of desirable length. • Few segments were also aggregated or divided based on the location of the point sources, flow and water quality stations. • Segments that were not included in the NHDPlusflowlinecoverage but included in the LSPC watershed model were added manually.
Boundary Conditions • LSPC Flows and Concentrations (Land Use only) • Instream • Overland • Water Temperature Functions • Meteorological Data • Wind - Fraction of Daylight • Solar Radiation • Light • Point Source Dischargers • Water Withdrawals • SSOs • Non-Failing Septics • Springs Same inputs as watershed model
Water Quality Calibration • Calibration period • January 1, 2001 through December 31, 2010 • 26 USGS Stations • Primary period of data – 2007 and 2008 • 8 Main Stem • 18 Tributaries • 5 MSD • 3 Main Stem • 2 Tributaries (Lower Chenoweth Run) • Quantitative Calibration • Qualitative Calibration • Focusing on Nutrient Species and Chlorophyll-a
Next Steps • Next TAC Meeting – Address any comments on modeling reports • Evaluate water quality targets • Begin running scenarios