Download
1 / 22
220 likes | 232 Views
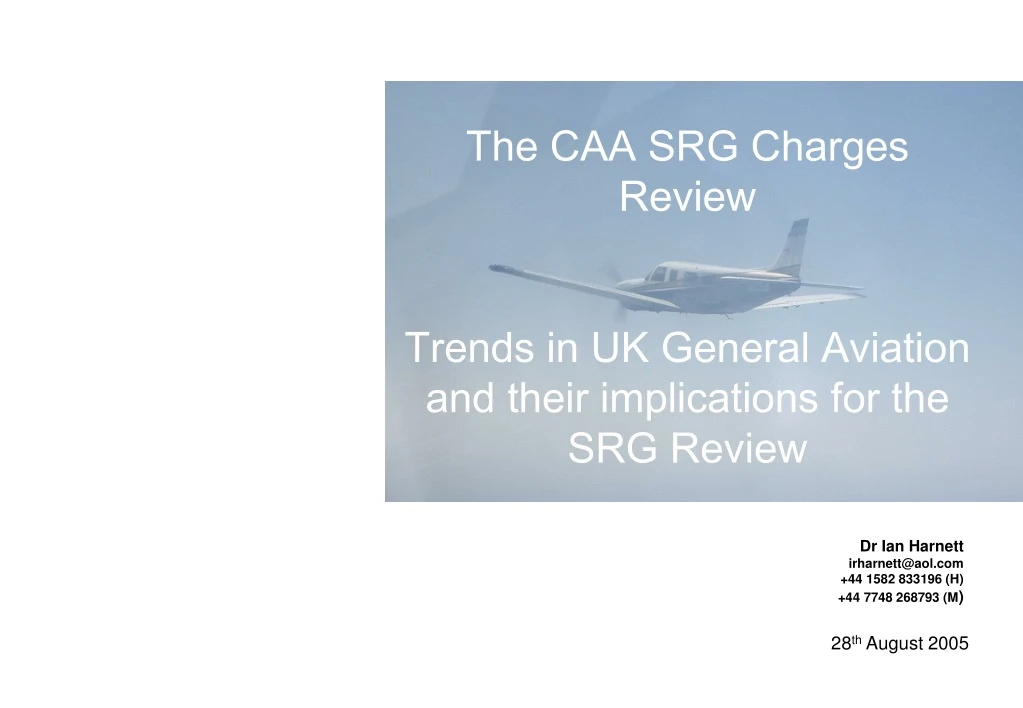
The CAA SRG Charges Review Trends in UK General Aviation and their implications for the SRG Review. Dr Ian Harnett irharnett@aol.com +44 1582 833196 (H) +44 7748 268793 (M ). 28 th August 2005. The CAA SRG Charges Review and recent trends in General Aviation.

E N D
The CAA SRG Charges ReviewTrends in UK General Aviation and their implications for the SRG Review Dr Ian Harnett irharnett@aol.com +44 1582 833196 (H) +44 7748 268793 (M) 28th August 2005
The CAA SRG Charges Review and recent trends in General Aviation The CAA SRG Costs and Charges Review is set to produce far reaching changes in the cost structure of the UK General Aviation regulatory framework as cross-subsidies, apparently identified in the report, are abolished. A major failing of the SRG Review appears to be that there is no examination of recent trends in aviation, and therefore no attempt at an economic impact assessment of how the proposed changes will impact UK GA. This report examines the trends in aircraft registration and usage, as well as flight crew licensing and airfield size that will affect the degree to which the proposed charging scheme is relevant, sustainable and safe. It also highlights some of the potential implications for the proposed schemes that can be inferred from these trends. • Aircraft Registration Trends (Charts 1-4) • Fixed-wing landplanes are now only 57% of UK registrations, down from 65% in 1985 as cheaper to buy, license and operate Microlights, SMLGs and Hang-gliders have become more popular – now some 24% of UK registrations from 17% in ‘85. • Large Commercial aircraft registrations have almost trebled over the last twenty years, twice the rate of any other sector. Declining registrations of small to mid-size AOC aircraft, in the last decade show signs of major distress in this sector. • There is no evidence that “cross-subsidies” have hindered commercial expansion. • Flight Crew Licensing (FCL) Trends (Charts 5-6) • There has been a major decline in full PPL issuance – down 40% since the early 1990s. The NPPL has only delayed the decline in PPLs. • By contrast, professional license issuance and renewals continue to grow and are now 50% of FCL activity, compared to 25% at the start of the 1990s. • On these trends a PPL currently costing £149 could rise to £216 in 2008, up 45%, not the £181 suggested in the report, in order to provide the same income. • Aircraft Activity Trends (Charts 7-10) • All the increase in reported airfield movements in the last 30 years has come from increased Commercial activity. GA activity, which accounted for 42% of total movements in 1976 now accounts for just 23%. • The level of GA movements is down some 30% from the early 1990s. The 10 airfields that handled the most GA movements in 1997, now handle some 28% less. Private aircraft movements are down some 45% at the 12 airfields (including Luton and Stansted) which, in 1997, saw the most private aircraft movements. • Airfield Activity Trends (Charts 11-13) • In 2004, just 10 airfields accounted for 46% of the 3.52 million recorded aircraft movements, with the smallest 30 airfields accounting for just 10%. • Much of the rise in aircraft movements since 1997 has come in large London Area airfields. The greatest pressures appear to have come on the middle sized regional airfields with Cardiff (-29%), East Midlands (-29%), Cambridge (-26%) and Norwich (-10%), with Teesside (-83%) and Liverpool (-87%). There is no comparable data for many smaller airfields.. • Airline Profitability Trends (Charts 14) • Having been in desperate straits post 9/11 (acknowledged as partly prompting the review), the UK Major Airlines produced profits of around £750m in 2003, with BA producing close to £400m of pre-tax, pre-exceptional earnings. The identified “cross-subsidies” are now worth only about 1% of airlines profits • There is no data on the profitability of the General Aviation industry. However, as anecdotal evidence suggests that these run largely on a break-even basis, the new charges removing the ”cross-subsidies” could well bankrupt many. • Conclusions for the SRG Report • The UK GA industry is already in a spiral dive. If the SRG charges are implemented the likelihood is more pilots dropping out of aviation, airfields closing, skilled aviation jobs being lost and, potentially, safety being compromised in order to save £7m of costs for the airlines – equivalent, as the BBGA highlighted in their minority report, to just 30p per passenger! • The lack of any meaningful examination of the dynamic impacts of the changed charging scheme raises severe doubts about its sustainability. • The change in SRG charges should be delayed and re-examined in the light of the trends that will emerge from the CAA Strategic Review of GA.
Aircraft Registration Trends – Commercial has grown fastest • The Key Facts • Aircraft registered with the CAA have risen by 73% between 1985 and 2004, from 9,815 to 17012. • The largest shift in the UK aircraft register is the falling share of fixed wing landplanes from 65% in 1985 to 57% in 2004, while the share of Microlights, SLMGs and Hang-gliders has increased from 17% to 24% as technology has made these more attractive and costs have increased for traditional light aircraft (See Chart 1). • Traditional GA light-planes weighing 750Kg-5700Kg remain 87% of all fixed-wing landplanes (See Chart 2). • However, Chart 3 shows that large commercial aircraft registrations have almost trebled since 1985 – a growth rate twice as rapid as any other class of fixed-wing landplane. • In the more recent past – since 1995 – there has been a slower pace of registration increase across all classes of aircraft, except for large Commercial aircraft (see Chart 4). • Chart 4 also shows the growing pressures on small and medium AOC’s in the last decade with registrations for aircraft in the 5701Kg-15000Kg weight class, falling by 9% since 1995. • Potential Implications for the SRG Review • There is no evidence that cross-subsidies in SRG charges has slowed the extraordinary pace of expansion of large commercial aircraft registration in either of the past two decades. • It is the small, or medium, size AOC operators where falling registrations point to evidence of increased commercial pressures or regulatory burdens. • The growth of Ultralight and Microlight activity and the slower pace of registrations for traditional light aircraft in the 750Kg-5700Kg range in the last decade suggests that either regulatory costs, fixed costs, or fuel costs have sharply impacted demand for PPL flying and suggests that pilots keenly adopt cheaper ways of flying. • This suggests that GA activity is probably highly sensitive to cost factors and regulatory burdens and that any significant increase in SRG charges will likely, further depress traditional GA activity.
Aircrew Licensing Trends – A dismal story for PPL Licenses • The Key Facts • The balance of Flight Crew Licensing (FCL) has shifted sharply in the last decade. In 1992/3 almost 2/3rds of licenses issued or renewed were PPLs; by 2003/4 the proportion of PPLs to professional licenses was close to 50/50. (See Chart 5) • The changing proportions represent a 17% fall in PPL issuances since 1992/3 and almost a 75% increase in professional license issues and renewals over the same period. • The decline in PPL issuance is even greater if the impact of the introduction of the NPPL is excluded. Full PPL’s issued and renewed are falling by 8%-10% per year and the total in 2004 (2329) was 40% less than the level (3827) seen in 1992/3. (See Chart 6) • The positive growth of NPPL’s appears to have been only temporary (as some pilots took advantage of the less onerous medical regulatory requirements and the lower cost of training) with total PPL issuance figures falling 14% in 2004/5 compared to 2003/4. • Potential Implications for the SRG Review • There is no evidence from FCL trends that any “cross-subsidy” in SRG charges has negatively impacted the growth rate of professional license issue, relative to the negative pressures on private license issuance. • The trend decline in PPLs is not examined in the SRG report. Similarly, the degree to which the positive impact of the NPPL has been due to reduced economic costs, or reduced medical requirements, has not been assessed. However, it may suggest that PPL licensing is very price sensitive and a further rise in SRG charges could provide a further negative to an existing negative trend. • The proposed charging structure appears to assume that the current level of licensing activity will persist – despite the increased charges and the sharply divergent trends in PPLs and professional license issues. • If PPL issuance continues to decline at 10% a year over the 2005-2008 period, the change in the license cost would not be from £149 to £181 (as suggested by the SRG report), but would have to rise to £216 in order to raise the same level of revenue – a rise of some 45% in 3 years! • The SRG report fails to explain why 6624 new license issues and renewals requires a section that costs some £8m, or over £1200 per issuance. Indeed, there is no assessment as to whether the size of FCL is appropriate to the absolute or changing level of activity.
Aircraft Movements Trends – Commercial boom and GA squeeze • The Key Facts • CAA data show 3.5 million recorded aircraft movements in 2004, up 85% from the 1.9 million movements recorded in 1976. The biggest growth has been in commercial movements, up almost threefold from 820,000 in 1976 to 2.4 million in 2004 . (See Chart 7) • GA activity – which is defined as aeroclub and private aircraft movements - is broadly flat over the same period at close to 830,000. However, as Chart 7 shows, there has been a 30% decline since the early 1990s. • Commercial movements now account for some 65% of all activity (72% if non-revenue earning and corporate business flights are included), compared to just 36% in 1976. GA movements have fallen to just 23% of total movements in 2004 from 42% in 1976. (See Chart 8) • The squeeze on GA is shown by the fact that for the 10 airfields that recoded the highest number of GA movements in 1997 (the most recent date for which detailed data are available on the CAA Website), activity levels had fallen 28% by 2004, with some of those airfields such as Liverpool, Cardiff and Teesside down 50%-85%. (see Chart 9) • Private aircraft movements have shown an even more negative trend. The 12 airfields with the highest number of private aircraft movements in 1997 have seen total activity levels fall 45% in just 8 years! In 1997, both Luton and Stansted handled over 10,00 private aircraft movements – these have fallen by 95% and 93% respectively. • Even airfields with a strong historic involvement with GA, such as Biggin Hill and Shoreham have seen private aircraft movements fall by 54% and 63% since 1997 according to the CAA data. • Potential Implications for the SRG Review • The trends in aircraft movements, again, show no empirical evidence that cross-subsidies in the current SRG cost structure has negatively impacted the growth of UK commercial aviation. • GA, however, has witnessed structural decline since the early 1990s. The JRT report fails to examine to how historic changes in the regulatory regime and cost structures have influenced these changing trends. • Increased charges at larger airfields such as Luton and Stansted, have been a major factor reducing GA activity levels – again suggesting that GA activity is highly price sensitive. • If the new SRG charges result in increased airfield charges and landing fees, GA pilots will probably shift away from licensed airfields towards smaller, potentially less safe (due to lack of fire cover), private airstrips. • A trend not captured in the CAA data at present is the growth of lower costs flying in Ultralights and Microlights from private sites. • The decline in GA activity likely to result from increased charges could see “aviation heritage” airfields such as Biggin Hill and Shoreham close to GA at a cost of aviation expertise, jobs and access for local communities.
Airfield Trends – Pressures on medium and smaller sites • The Key Facts • In 2004 the 10 largest airfields (by number of movements) accounted for 46% of all activity recorded by the CAA, while the smallest 30 airfields for which the CAA collected data accounted for just 10% of the 3.52 million aircraft movements. (See Chart 11). • Since 1997, London Area airfields have seen much of the absolute (and percentage) growth in airport movements. Stansted and London City, both seeing over 80% movement growth (adding 87,000 and 26,000 respectively) and Luton up 48% (30,000 movements). Even the 8% growth at Heathrow added 35,000 aircraft movements. Outside London an increase of 56,000 movements at Manchester is the major change. (Chart 12) • Mid-sized regional airfields have been under pressure and have seen movements falling - such as Cardiff (-29%),East Midlands (-29%),Cambridge (-26%) and Norwich (-10%), with Teesside (-83%) and Liverpool (-87%). • The pressure on regional airfields with around 50,000-100,000 movements is shown by Chart 13. In 1997 there were 23 airfields with between 50,000 and 100,000 movements per year, by 2004 this had dropped to 20, with only one airfield increasing its activity above 100,000. The number of airfields with 10,000-50,000 movements has risen from 19 to 24 – but is far from a sign of a healthy situation, reflecting the lower activity rates in previously larger airfields . • Potential Implications for the SRG Review • The changes in the Aerodrome Licensing cost structure appears major. However, the changes appear not to have been set in an historical context in order to establish their sustainability. The lack of any available profitability data for small airfield operators also means that no economic impact assessment has been possible. • The banding proposed in the JRT report may be too coarse. Two groups covering 10K-50K and 50K-100K would allow a greater possibility of medium sized aerodromes continuing to be viable, with a further grouping for airfields with over 100K movements. • The new charges will hit hardest on those least able to recoup the costs. An category A1airfield – with more than 150K of movements - will see an increase of £30,844, equivalent to less than a 20p per movement. A D1 category aerodrome - with less than 2,000 movements annually, will see a five fold increase in charges from £1441 to £7170, or £2.80 per movement. • Small aerodromes (<2,000 movements) will face either a large increase in landing fees with a consequent decline in aircraft movements, a shift towards de-licensing of these smaller airfields – reducing safety cover for the GA segment of the aviation community due to the reduced fire cover required. Alternatively, smaller airfields will be forced to close with a consequent impact on local employment – and community access.
UK Airline Profitability Trends – The post 9/11 pressure has eased • The Key Facts • The SRG review was instituted in the wake of 9/11 with the UK airline industry under acute financial pressure. As the SRG consultation document (June 10th 2005) says, “Concerns about this issue [cross-subsidies] increased significantly after the 9/11 terrorist attacks” • Chart 14 shows that while there was indeed major pressure on UK airlines in 2001, by 2003 overall profitability has been restored, with the industry as a whole generating close to £750m pre-tax, pre-exceptional profit. • BA, one of the main driving forces behind the SRG Review, has recovered well, to generate pre-tax, pre-exceptional profits back at the levels of 1998 of over £400m. • There is no equivalent data collected by the CAA to examine the financial health of the General Aviation sector and the extent to which any changes in charging structure are likely to impact their longer-term viability. Indeed, the anecdotal evidence is that most general aviation takes place at close to break-even level (or below). • Potential Implications for the SRG Review • Once again, there is not evidence that the current cost structure of the SRG charges, or any supposed “cross-subsidies” is preventing the UK commercial aviation industry from making considerable profits. Indeed, it could be argued that it is the regulatory environment that ALLOWS the UK airlines to make these profits and prevents non-regulated competition. • There is no recognition in the SRG review that the CAA regulatory environment is established primarily for commercial passenger safety and, as the BBGA minority report suggested, this is where any increased charges should be levied, at a cost of just 30p per passenger trip. • The cross-subsidies identified in the report appear to be worth around £7m – less than 1% of the UK airlines total profits. However, an increase in such costs for GA could lead to widespread bankruptcy in the sector. • Without examining the economic health of the general aviation sector the correct SUSTAINABLE charging structure cannot be established. • The lack of data about the economic viability of general aviation in the UK should make an agency dedicated to safety wary. Adding significant additional costs to a sector that is already under apparent stress is likely to result is an increase willingness to take “safety-critical” risks in order to meet stretched financial commitments.
Conclusions – GA has entered a spiral dive...in IFR There is little evidence that the cross-subsidies identified in the SRG Charges Review have had any discernible effect slowing the pace of growth in either commercial flying, licensing activity or even its profitability. The trends that are emerging for GA, however, suggest that the sector is highly price sensitive and has entered into a spiral dive, even before the proposed increases in SRG charges. The lack of data on the GA sector is akin to this developing in IFR.... • AIRCRAFT REGISTRATIONS • The continued growth in UK aircraft registrations hides several major trend changes. Large Commercial aircraft registrations have shown rapid growth over the last twenty years. Declining registrations of small to mid-size AOC aircraft, in the last decade, show signs of major distress in this sector. • General Aviation has seen traditional light-plane registrations growth less rapidly than cheaper to buy, license and operate Microlights and Ultralights. • FCL LICENSING • There has been a major decline in full PPL issuance – down 40% since the early 1990s. The NPPL has only delayed the decline in PPLs. By contrast professional license issuance and renewals continue to grow and are now 50% of FCL activity, compared to 25% at the start of the 1990s. • AIRCRAFT ACTIVITY • All the increase in reported airfield movements has come from increased Commercial activity. GA activity which accounted for 42% of total movements in 1976 now accounts for just 23%. • The level of GA movements are down some 30% from the early 1990s. The 10 airfields that in 1997 handled the most GA movements, now handle some 28% less. Private aircraft movements are down some 45% at the 12 airfields which, in 1997, saw the greatest private aircraft movements, with airfields such as Luton and Stansted now virtually no-go areas due to increased landing charges and compulsory handling charges. • AIRFIELD ACTIVITY • The 3.52 million recorded aircraft movements in 2004 were highly concentrated in the larger airfields, with just 10 airfields accounting for 46% of all movements and the smallest 30 airfields accounting for just 10%. • Much of the rise in aircraft movements since 1997 (the most recent date with detailed figures) has come in large London Area Airfields. The greatest pressure appears to have come on the middle sized regional airfields with Cardiff (-29%), East Midlands (-29%), Cambridge (-26%) and Norwich (-10%), with Teeside (-83%) and Liverpool (-87%). There is no available data for many smaller airfields. • AIRLINE PROFITABILITY • Having been in desperate straits in 2001 (which partly prompted the SRG review), the UK Major Airlines produced profits of around £750m in 2003 – with BA producing close to £400m of pre-tax, pre-exceptional earnings. By contrast there is no available data on the profitability of the General Aviation industry, but anecdotal evidence suggests that most activities run on a break-even basis. • THE SRG REVIEW • The SRG costs and charges review has, apparently, failed to examine any of these trends. The lack of any economic impact assessment of the changes means that there is no assessment of the sustainability of the proposed charges. • The trends outlined in this report suggest that if the SRG charges are implemented as they stand, then, when the recently commenced CAA review of GA aviation and regulation reports back, it may already be too late to prevent many more pilots dropping out of aviation, airfields closing and jobs being lost. • Let us hope that the changed charges do not lead anyone in GA compromising on safety in order to save the £7m of costs identified – equivalent to less than 1% of UK airlines profits – or as the BBGA highlight, 30p per passenger trip! • It is essential that that the introduction of the new SRG charges should be delayed and re-examined in the light of the forthcoming CAA Strategic Review of General Aviation in the UK.