Accounting for Merchandise Inventory
610 likes | 855 Views
Accounting for Merchandise Inventory. Chapter 6. Inventory Accounting Systems. Perpetual systems maintain a running record to show the inventory on hand at all times. Periodic systems do not keep a continuous record of inventory on hand.

Accounting for Merchandise Inventory
E N D
Presentation Transcript
Accounting for Merchandise Inventory Chapter 6
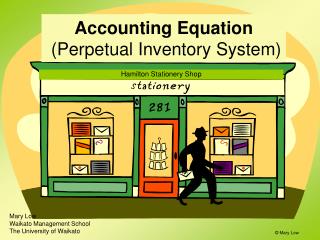
Inventory Accounting Systems Perpetual systems maintain a running record to show the inventory on hand at all times. Periodic systems do not keep a continuous record of inventory on hand.
Compute and record journal entries for perpetual inventory amounts under FIFO, LIFO, and average cost. Objectives 1 and 2
Perpetual System Debit Inventory Credit Cash or Accounts Payable Debit Cash or Accounts Receivable Credit Sales Revenue Debit Cost of Goods Sold Credit Inventory
Computing the Cost of Inventory • Physical count is made at least once a year, even with a perpetual system. • Consigned goods are excluded. Cost of inventory on hand = Quantity × unit cost
Perpetual System Examples • Assume the following: Nov. 1 Beg. Inventory 1 @ $40 15 Purchase 6 @ $45 15 Sale 4 26 Purchase 7 @ $50 30 Sale 8
Perpetual System FIFO Example • Many companies keep their perpetual inventory records in quantities only. • Other companies keep perpetual records in both quantities and dollar cost.
Perpetual FIFO • Consistent with the physical flow of inventory • Oldest inventory sold first • Most recent purchases make-up ending inventory
Perpetual System FIFO Example Columbia Sportswear Item: Ski Parka Received Sold Balance on Hand Unit Unit Unit Date Qty. Cost Total Qty. Cost Total Qty. Cost Total Nov. 1 1 $40 $40 5 6 $45 $270 1 40 40 6 45 270 15 1 40 40 3 45 135 3 45 135
Perpetual System FIFO Example Columbia Sportswear Item: Ski Parka Received Sold Balance on Hand Unit Unit Unit Date Qty. Cost Total Qty. Cost Total Qty. Cost Total Nov. 26 7 $50 $ 350 3 $45 $135 7 50 350 30 3 $45 135 5 50 250 2 50 100 Totals 13 $ 620 12 $560 2 $100
Perpetual System FIFO Example Nov. 5 Inventory………….…270 Accounts Payable……270 15 Accounts receivable…320 Sales Revenue……….350 15 Cost of Goods Sold…175 Inventory…………….175
Perpetual System FIFO Example Nov. 26 Inventory………….…350 Accounts Payable……350 30 Accounts receivable…640 Sales Revenue……….640 30 Cost of Goods Sold…385 Inventory…………….385
Perpetual LIFO • Is not consistent with the physical flow of inventory • Oldest inventory costs make-up ending inventory • Cost of goods sold is assumed to be from the most recent purchases
Perpetual System LIFO Example Columbia Sportswear Item: Ski Parka Received Sold Balance on Hand Unit Unit Unit Date Qty. Cost Total Qty. Cost Total Qty. Cost Total Nov. 1 1 $40 $40 5 6 $45 $270 1 40 40 6 45 270 15 4 45 180 1 40 40 2 45 90
Perpetual System LIFO Example Columbia Sportswear Item: Ski Parka Received Sold Balance on Hand Unit Unit Unit Date Qty. Cost Total Qty. Cost Total Qty. Cost Total Nov. 26 7 $50 $ 350 1 $40 $135 2 45 90 7 50 350 30 7 $50 350 1 45 45 1 40 40 1 45 45 Totals 13 $ 620 12 $575 2 90
Perpetual System LIFO Example Nov. 5 Inventory………….…270 Accounts Payable……270 15 Accounts receivable…320 Sales Revenue……….350 15 Cost of Goods Sold…180 Inventory…………….180
Perpetual System LIFO Example Nov. 26 Inventory………….…350 Accounts Payable……350 30 Accounts receivable…640 Sales Revenue……….640 30 Cost of Goods Sold…395 Inventory…………….395
Perpetual System Average Cost • Ending inventory and cost of goods sold are based on the average cost per unit. • A new average cost per unit is computed after each purchase.
Perpetual System Average Cost Example Columbia Sportswear Item: Ski Parka Received Sold Balance on Hand Unit Unit Unit Date Qty. Cost Total Qty. Cost Total Qty. Cost Total Nov. 1 1 40.00 40 5 6 $45 $270 7 44.29 310 15 4 44.29 177 3 44.29 133
Perpetual System Average Cost Example Columbia Sportswear Item: Ski Parka Received Sold Balance on Hand Unit Unit Unit Date Qty. Cost Total Qty. Cost Total Qty. Cost Total Nov. 26 7 $50 $ 350 10 48.30 483 30 8 48.30 386 2 48.30 97 Totals 13 $ 620 12 $563 2 $ 97
Perpetual System Average Cost Example Nov. 5 Inventory………….…270 Accounts Payable……270 15 Accounts receivable…320 Sales Revenue……….350 15 Cost of Goods Sold…177 Inventory…………….177
Perpetual System Average Cost Example Nov.26 Inventory………….…350 Accounts Payable……350 30 Accounts receivable…640 Sales Revenue……….640 30 Cost of Goods Sold…386 Inventory…………….386
Objective 3 Compare the effects of FIFO, LIFO, and average cost
Comparison of Methods EndingInventory FIFO $100.00 LIFO $ 90.00 Weighted-average $ 97.00
Comparison of Methods Cost of Goods Sold FIFO $560.00 LIFO $575.00 Weighted-average $563.00
Comparison of Methods • Gross Margin from Sales: FIFO $400.00 LIFO $ 385.00 Weighted-average $ 397.00 When prices are rising LIFO produces the lowest income and lowest income tax.
Compute periodic inventory amounts under weighted-average cost, FIFO, and LIFO. Objective 4
Cost-of-Goods-Sold Model Budgeted Cost of Goods Sold + Budgeted Ending Inventory Budgeted Cost of Goods Available for Sale = – Actual Beginning Inventory = Purchases
Cost of Goods Sold under a periodic Beginning Inventory $100,000 Net Purchases $560,000 + = Cost of Goods Available for Sale $660,000 Cost of Goods Sold $540,000 Ending Inventory $120,000 – =
Periodic System Inventory Purchases 100,000 Beginning Balance 100,000 Beginning Balance 560,000 Purchases 560,000 Purchases 120,000 Ending Balance Cost of Goods Sold 120,000 Ending Balance 100,000 560,000 540,000 Accounts Payable 560,000 Purchases
Periodic System • At the end of the period make a physical count and apply unit cost to determine ending inventory. • Inventory purchases are debited to the purchases account. • The inventory account carries the beginning inventory balance until adjusted at period end.
Units Purchased in 20xx January 8 20 units @ $20 = $ 400 May 19 55 units @ $30 = $1,650 October 23 25 units @ $31 = $ 775 Total units 100 Units sold 70 Units left 30
Units Sold and in Ending Inventory Units sold by date: Jan 5 17 May 19 33 Oct 23 20 Total sales 70 30 units left in inventory
Specific Identification 20 Units @ $31 5 Units @ $31 Cost of Goods Sold Oct 23 $ 620 May 19 990 Jan 5 340 Total $1,950 33 Units @ $30 22 Units @ $30 17 Units @ $20 3 Units @ $20
Specific Identification 20 Units @ $31 5 Units @ $31 Ending Inventory Oct 23 $155 May 660 Jan 60 Total $875 33 Units @ $30 22 Units @ $30 17 Units @ $20 3 Units @ $20
Weighted Average 25 Units @ $31 (Oct) = $ 775 = 1,650 = 400 = $2,825 Total Cost 55 Units @ $30 (May) 20 Units @ $20 (Jan) 100 Total Units
Weighted Average $2,825 total cost/100 units = $28.25/unit Cost of goods sold = 70 × $28.25 = $1977.50 Ending inventory = 30 × $28.25 = $847.50
First-In, First-Out 25 Units @ $31 (Oct) Cost of Goods Sold Jan $ 400 May 1,500 Total $1,900 5 Units @ $30 (May) 50 Units @ $30 20 Units @ $20 (Jan)
First-In, First-Out 25 Units @ $31 (Oct) Ending Inventory Oct $775 May 150 Total $925 5 Units @ $30 (May) 50 Units @ $30 20 Units @ $20 (Jan)
Last-In, First-Out 25 Units @ $31 (Oct) Cost of Goods Sold Oct $ 775 May 1,350 Total $2,125 45 Units @ $30 (May) 10 Units @ $30 20 Units @ $20 (Jan)
Last-In, First-Out 25 Units @ $31 (Oct) Ending Inventory Oct $300 May 400 Total $700 45 Units @ $30 (May) 10 Units @ $30 20 Units @ $20 (Jan)
Comparison of Methods EndingInventory Specific identification $875.00 FIFO $925.00 LIFO $700.00 Weighted-average $847.50
Comparison of Methods Cost of Goods Sold Specific identification $1,965.00 FIFO $1,900.00 LIFO $2,125.00 Weighted-average $1,977.50
Comparison of Methods • Gross Margin from Sales: • Specific identification $1,035.00 • FIFO $1,100.00 • LIFO $ 875.00 • Weighted-average $1,022.50 When prices are rising LIFO produces the lowest income and lowest income tax.
The Income Tax Advantage of LIFO • During periods of inflation, LIFO’s income is the lowest. • The most attractive feature of LIFO is reduced income tax payments.
LIFO Liquidation • When prices are rising... • the company draws down inventory quantities below the level of the previous period which releases older costs to the income statement.
Accounting Principles: Consistency The business should use the same accounting methods and procedures from one period to the next. A company may change inventory methods, but it must disclose the effects of the change on net income.
Accounting Principles: Disclosure The financial statements should report enough information to enable an outsider to make knowledgeable decisions about the company.
Accounting Principles: Materiality An item is material if it has the potential to alter a statement user’s decision. Materiality is specific to the entity being evaluated.