Download
1 / 40
400 likes | 578 Views
Project to Assess Climate in Engineering (PACE): PACE Findings. PACE Meeting at AAAS March 17 & 18, 2010. Common Goals. More Students Recruited and Retained in Engineering More Diverse Populations Underrepresented Minorities Women. 2008 Bachelor’s Degrees (ASEE). Thinking Strategically.

E N D
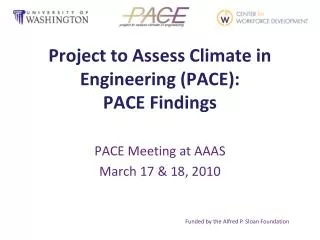
Project to Assess Climate in Engineering (PACE):PACE Findings PACE Meeting at AAAS March 17 & 18, 2010 Funded by the Alfred P. Sloan Foundation
Common Goals • More Students Recruited and Retained in Engineering • More Diverse Populations • Underrepresented Minorities • Women Funded by the Alfred P. Sloan Foundation
2008 Bachelor’s Degrees (ASEE) Funded by the Alfred P. Sloan Foundation
Thinking Strategically • Each school has unique circumstances • All schools have some commonalities • How do we learn from each other to put all the pieces together and improve student retention? Funded by the Alfred P. Sloan Foundation
PACE Goals • Overall goal is to improve retention among all engineering undergraduates • Action steps to achieve this goal: • Data: Provide data that will help identify areas that require attention in order to improve academic climate • Benchmarking: Provide aggregated and institution-specific data organized by sex and racial/ethnic categories for purposes of benchmarking with peer institutions • Follow-ups: Conduct follow-ups with schools after receipt of the PACE Final report to track actions taken to improve the climate Funded by the Alfred P. Sloan Foundation
PACE Schools Funded by the Alfred P. Sloan Foundation
PACE Schools Funded by the Alfred P. Sloan Foundation
PACE Mixed-Mode Method • Online survey • Sample: Current engineering students • Oversampled under-represented groups • 38,376 students invited • 10,554 completions • Median response rate: 28% • Final sample size of 10,366 • On-site Interviews • Sample: Current and former engineering students • Oversampled under-represented groups • 179 interviews completed at 16 schools, 124 current students and 55 former students Funded by the Alfred P. Sloan Foundation
Survey Respondent Demographics Funded by the Alfred P. Sloan Foundation
Respondent Representativeness Positive percentages indicate group is overrepresented among respondents while negative percentages indicate group is underrepresented among respondents. Funded by the Alfred P. Sloan Foundation
Interviewee Demographics Funded by the Alfred P. Sloan Foundation
Sneak Peek at New PACE Findings • Intersection of Gender, Race/Ethnicity and Student Experience • Four main areas: • Professor-Student Interaction • Student-Student Interaction • Confidence • Risk of Attrition Funded by the Alfred P. Sloan Foundation
School Representation • No one school accounts for more than 13 percent of the African American survey respondents and every school contributes to the number. • Hispanic American Survey Respondents: One school contributes 22 percent, two schools combined contribute 28 percent, and all other schools contribute to the Hispanic American survey respondent number. Funded by the Alfred P. Sloan Foundation
Analysis Methods • 2 x 2 Contingency Tables • 5 point scales reduced to binary variables • Chi-Square: Are two variables associated? • Adjusted Residuals: Where is the association? • Values > |2| • Odds Ratios: How strong is the association? • OR=1=no effect, OR>1=increase in odds, OR<1=decrease in odds Funded by the Alfred P. Sloan Foundation
Variables Professor-Student Interaction • Do your professors inspire you to study engineering? • Are you comfortable asking questions in class? • Do your professors care whether or not you learn the course material? Student-Student Interaction • Do you feel like you are part of an engineering community? • Do other students take your comments/suggestions in class seriously? • Do students compete with each other in your classes? • Do engineering students help each other succeed in class? Funded by the Alfred P. Sloan Foundation
Variables Confidence (Strongly Disagree, Somewhat Disagree, Neutral, Somewhat Agree, Strongly Agree) • I am confident in my ability to succeed in my college engineering courses Risk of Attrition (Strongly Disagree, Somewhat Disagree, Neutral, Somewhat Agree, Strongly Agree) • I have no desire to declare a non-engineering major (e.g. biology, theater, English, philosophy) • I can think of other majors that I would like better than engineering Funded by the Alfred P. Sloan Foundation
Odds Ratios for Comparisons of Race Within Gender Category Funded by the Alfred P. Sloan Foundation
Odds Ratios for Gender Comparisons within Race Funded by the Alfred P. Sloan Foundation
Risk of Attrition Funded by the Alfred P. Sloan Foundation
Conclusion, Race Differences • Inspiration by professors operates differently for Hispanics than for African Americans, compared to Whites • Minorities not taken seriously by peers, compared to Whites (true for men and women) • Greater disparities between females of different races than males of different races • All related to professor-student and student-student interaction Funded by the Alfred P. Sloan Foundation
Conclusion, Gender Differences • None among African Americans • Among Hispanics, gender affects professor interaction, confidence and risk of attrition • Females less comfortable asking questions, less confident, more likely to like other majors better. • Among Whites, gender affects professor, student interactions, confidence and risk of attrition • Females more positive about student-student interaction, believe professors care if they learn, like other majors better • Females less comfortable asking questions, less confident, less likely to say “no desire to declare non-engr major. Funded by the Alfred P. Sloan Foundation
Take Away • One “size” approach does NOT fit all. • Risk of Attrition highest for: African American Males, White women and Hispanic women. • About 28 percent of students have some desire to declare a non-engineering major Funded by the Alfred P. Sloan Foundation
Plans for the Future • What kinds of policies/programs will address the findings discussed today? • Multivariate analyses!! • What does the rich pool of information from the interviews tell us about these questions? Funded by the Alfred P. Sloan Foundation
Thank you! • For the time, energy and resources you have committed to the PACE study. • For your commitment to improving student experiences and thus retention • For your attendance at this important meeting Funded by the Alfred P. Sloan Foundation
Retention Results Funded by the Alfred P. Sloan Foundation
Retention Results Funded by the Alfred P. Sloan Foundation
Retention Results Funded by the Alfred P. Sloan Foundation
Quality of Teaching dCohen in parentheses Funded by the Alfred P. Sloan Foundation
Professors Funded by the Alfred P. Sloan Foundation
Professors Funded by the Alfred P. Sloan Foundation
Teaching Assistants Funded by the Alfred P. Sloan Foundation
Student Interaction Funded by the Alfred P. Sloan Foundation
Student Interaction Funded by the Alfred P. Sloan Foundation
Perceptions of Engineering Careers Funded by the Alfred P. Sloan Foundation
Perceptions of Engineering Careers Funded by the Alfred P. Sloan Foundation
Confidence in Ability to Succeed Funded by the Alfred P. Sloan Foundation
Engineering Major Funded by the Alfred P. Sloan Foundation
Personal Experience: Race • African American respondents were more than 30 times more likely than Whites to say they had been singled out because of race. • Hispanic respondents were nearly five times more likely than Whites to say they had been singled out because of race. • Native American respondents were nearly seven times more likely than Whites to say they had been singled out because of race. Funded by the Alfred P. Sloan Foundation
Personal Experience: Sex • Females were nearly 20 times more likely than males to report they had been singled out because of gender. • Females were more than three times more likely than males to report they had heard faculty express gendered stereotypes. • Females were more than five times more likely than males to report they had been sexually harassed by an engineering student. Funded by the Alfred P. Sloan Foundation
Take-Away • One “size” does NOT fit all • Women: Confidence, ability comparison, family friendly perceptions, engr. community • African Americans: classroom issues, ability comparison, help others succeed, • Hispanic/Latino: no medium to strong effects • Native American: help others succeed, ability comparison, job prospects Funded by the Alfred P. Sloan Foundation