Download
1 / 48
480 likes | 607 Views
Carbon Footprints & Sustainable Solutions:. Inspiring NC Youth to Address Global Warming. Dana Haine UNC-CH Institute for the Environment. The Environmental Resource Program. Serves as the outreach and public service arm of UNC’s Institute for the Environment.

E N D
Carbon Footprints & Sustainable Solutions: Inspiring NC Youth to Address Global Warming Dana Haine UNC-CH Institute for the Environment
The Environmental Resource Program • Serves as the outreach and public service arm of UNC’s Institute for the Environment. • Promotes environmental stewardship and public health through education, research, and community service. • Links the environmental resources of UNC to the people of North Carolina.
Session Agenda • Welcome and Introductions • Activity 1: What is your Carbon Footprint? • Activity 2: What is Sustainability? • Activity 3: Hidden Energy: Secondary Carbon Footprints
List the various ways you depend on energy in a typical day.
List the various ways you depend on energy in a typical day.
American Energy Consumption • Americans consume 40% more energy per person compared to the world average. United States 8.35 TOE/person World 5.0 TOE/person Total primary energy supply TOE (tons of oil equivalent) per person (2000). lEA, Energy Balances of OECD Countries 1999-2000 (lEA, Paris, 2001).
Where does our energy come from? • Fossil fuels (Natural Gas, Oil, Coal) • Nuclear Power • Hydropower • Wind Power • Solar Power • Landfill Methane Renewable Energy
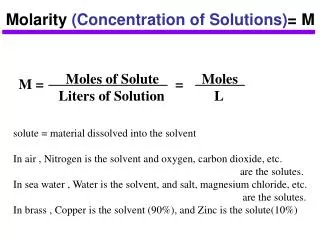
What is the connection between Energy and Carbon Dioxide? = Energy Use CO2 makes up approximately 85 percent of total greenhouse gas (GHG) emissions.
What is the connection between Carbon Dioxide and Global Warming? http://www.fightglobalwarming.com/page.cfm?tagID=273
What human activity produces the most greenhouse gases (CO2)?
What human activity produces the most greenhouse gases (CO2)? • Electricity Generation • Transportation • Industry • Agricultural • Commercial • Residential Inventory of U.S. Greenhouse Gas Emissions and Sinks: 1990-2004, EPA.
Electricity Generation: • Where does your electricity come from? EPA’s Power Profiler
Activity 1:What is your Carbon Footprint? • Go to EPA’s Carbon Footprint Calculator http://www.epa.gov/climatechange/emissions/ind_calculator.html • Please complete the companion Carbon Footprint worksheet (provided) as you calculate your carbon footprint.
Carbon Reduction Solutions • What can YOU do to reduce your carbon footprint?
Carbon Reduction Solutions • Reducing CO2 emissions benefits: • The environment • The economy • Society • Practices that benefit all three of these are said to be sustainable.
Dr. Seuss's The Lorax can be used to help students discover the concept of sustainability.
Sustainability • Common use of the term “sustainability" began with the 1987 publication of the World Commission on Environment and Development report, Our Common Future.
Sustainable Development • “Development that meets the needs of the present without compromising the ability of future generations to meet their own needs.” • Our Common Future
Three Parts of Sustainability Healthy Environment Healthy Economy Healthy Society From: http://www.sustainablemeasures.com
Is this sustainable? http://www.chrisjordan.com/
Is it Sustainable? • Can this activity be done without causing damage in these three areas? • Can this activity be done so that people in the future will have the same opportunities to do this activity?
Is it Sustainable? Driving Think-Pair-Share Activity #1
Driving Environment Economy Society How does driving impact the:
Is it Sustainable? Choose one: Individual Activities School Activities Government Actions Business Products/Services Think-Pair-Share Activity #2
Is it Sustainable? • In your group, assess the sustainability of one activity from this list and determine whether it is economically, environmentally, and/or socially sustainable. • You need to be able to explain your decision(s) to the class.
Sustainability Scale Can something that is unsustainable be altered to become more sustainable? Choose an unsustainable activity and explain how it could be made more sustainable.
Three parts of sustainability: Two Interpretations From: http://www.sustainablemeasures.com
Carbon Reduction Solutions • Reducing CO2 emissions benefits: • The environment • The economy • Society • Practices that benefit all three of these are said to be sustainable.
Carbon Reduction Solutions • Individual behaviors and consumer choices impact an individual’s carbon footprint.
New Zealand raised lamb Pasture-raised 11,000 miles by boat to UK 1,520 lbs CO2/ton UK raised lamb Conventionally grown, feed-reliant 6,280 lbs CO2/ton One Strategy – Eat Local? Is eating local always better? From study conducted at Lincoln University in New Zealand
Food Miles versus Lifecycle Assessment • “Localism is not always the most environmentally sound solution if more emissions are generated at other stages of the product life cycle than during transport.” • Landcare Research Manaaki Whenua, A New Zealand Environmental Research Organization
Activity 3: Hidden Energy Everyday Items have Carbon Footprints
Hidden Energy:Secondary Carbon Footprints • Observe the object in front of you. • Use the poster paper and markers provided to draw/diagram the materials used to make, market, utilize and dispose of this object.
Hidden Energy • Consider the following as you observe this object: • Raw materials • Manufacturing • Packaging, transport, and storage • Marketing • Use/Lifespan • Disposal
Hidden Energy • Finally, indicate the steps on your diagram that use energy and result in CO2 emissions.
Hidden Energy • View your object from the perspective of the manufacturer: How can the carbon footprint of your object be reduced? • View your object from the perspective of the consumer: How can the carbon footprint of your object be reduced?
Hidden Energy In the News • “Wal-Mart asks Suppliers to Rate Energy Use” The Wall Street Journal, September 24, 2007 • 25 – 30 companies that supply products such as DVDs, toothpaste, soap, milk, beer, vacuum cleaners, and soda will be asked to measure the amount of energy used to manufacture their products. • The company wants to cut packaging waste, increase fuel efficiency, and eventually operate entirely on renewable energy.
Hidden Energy & The Informed Consumer • Carbon Labeling • Sustainability Ratings • Eco-labels & Green Certification
Sustainability Ratings C+ D+
Carbon Reduction Solutions • Individual behaviors and consumer choices impact an individual’s carbon footprint.
Acknowledgements • ERP Staff • Christie Hinson, Civic Education Consortium, UNC • Terri Buckner, Office of Sustainability, UNC • Z. Smith Reynolds Foundation
Contact Information Dana Haine, Science Educator Environmental Resource Program, UNC Institute for the Environment dhaine@unc.edu (919) 843-5735