Download
1 / 9
110 likes | 158 Views
Learn how to graph linear inequalities in the coordinate plane, determining the boundary line's nature and shading the correct region based on the inequality symbol. Practice with examples and solutions included.

E N D
Graphing Linear Inequalities • A linear inequality describes a region of the coordinate plane that has a boundary line. (This region is called a half-plane.) • Every point in that region is a solution of the inequality.
Solutions • When the inequality symbol has an “or equal to” (>, <, =) symbol, the boundary line is part of the solution. • The boundary line will be a solid line. • Whenthe inequality symbol is just greater or less than (>, <), or not equal (≠), the boundary line is NOT part of the solution. • The boundary line will be a dashed line.
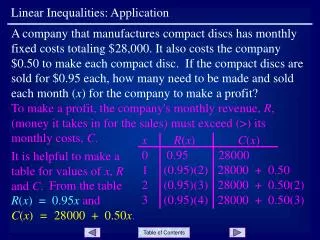
You have a gift card for Itunes worth $20. An album cost $5 and a single song cost $1. What are all the possible combinations of albums and single songs you can buy? How can we graph this ?
Example 1 • Graph: 5a +s ≤20 • Convert to slope intercept form! • Graph the line. • Decide if the line should be solid or dashed. • Decide whether to shade above or below the line by using a test a point below or above the line , usually (0,0)
Example 2 • Graph: y < 3x – 2 • Remember that (0, –2) is the y-intercept. • Remember that 3 (or 3/1) is the slope. • Graph the line. • Decide if the line should be solid or dashed. • This would be dashed. • Decide whether to shade above or below the line by testing a point below or above the line
(0, 0) Example 1 Solution • Graph: y < 3x – 2 • Graph the line --Dashed • Shade --Below the line • Check a point (0, 0) • y < 3x – 2 0 < 3(0) - 2 0 < -2 False—so not in shaded area
(0,b) Example 2: Write an inequality for the graph. • Write the equation of the line in slope-intercept form (y = mx + b). - Find the y-intercept (0, b). • Find the slope (m) using rise over run. • Decide on the inequality symbol. • Since the shading is above the line, use greater than ( >). • Since the line is solid, use the “or equal to” ( > ). • Inequality: y > -2/3x + 4