Download

1 / 29
290 likes | 406 Views
Using a Database And Datacube to Rapidly A ssess Fluxnet Data. bwc technical team 24 July 2007. Background. Carbon-climate researchers from around the world have contributed data toward global scale synthesis analyses.

E N D
Using a Database And Datacube to Rapidly AssessFluxnet Data bwc technical team 24 July 2007
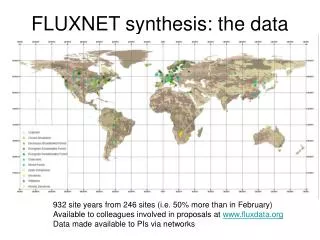
Background • Carbon-climate researchers from around the world have contributed data toward global scale synthesis analyses. • Over 700 site-years of data available from over 200 sites around the world. • The carbon flux and meteorological data are being processed to assign quality, gap-fill, and derive additional scientific data products. • To be eligible for this processing, the data must meet certain minimal criteria. • This data qualification has proved to be a significant part of the effort necessary to process the data.
Can a database and/or datacube help? • The existing qualification processing uses a combination of scripts, MatLab plots and direct data viewing of each site-year. • We think that running a few database queries and simple data cube visualizations could reduce that effort. • Goal is to identify the most obvious problem site-years well enough that direct data viewing would be unnecessary. • Review by a scientist will still be necessary for the more subtle problems
Let’s try…. • To test this idea, we ran some simple queries and data cube reports on the L2 data available on the Ameriflux web site in May 2007. • 372 site-years from 84 sites in the Americas • The database contains the same half-hourly flux-met data used for the Fluxnet qualification processing. • The datacube contains daily values derived from the half-hourly data. • Each of the quality criteria we understand was considered in turn. ftp://cdiac.ornl.gov/pub/ameriflux/data/Level2/standardized_files/with_gaps/
Data Coverage criteria The following variables are mandatory. CO2 flux (FC) should not be gap-filled or ustar filtered CO2 concentration at the top of the tower (CO2_top) and/or storage flux (SFC or SCO2); not required for grassland or cropland sites Ustar (UST) or momentum (TAU) Global incoming radiation (RG_in) or photosynthetic radiation (PPFD or PAR_in) Air temperature (TA) Water vapour concentration (H2O) and/or relative humidity (RH • Roughly 40% of the site-years do not meet these criteria
FC reporting by site by year • Plot shows fraction of half-hourly FC data reported for site-year by site • Values of 1 (no gaps) likely are investigator gap filled (instruments fail!). • Values around .5 are likely hourly rather than half-hourly reporting. • Values of .25 are likely too sparse to support synthesis analysis Of 372 potential site-years of data, only 285 have .3 < FC reporting < .999
Required variable reporting by site by year • Each row corresponds to one site-year • Each cell corresponds to one site year of (FC, CO2 or SCO2, UST, PAR or Rg, TA, and Rh or H2O). • Color indicates: • Red – likely not enough for processing - % < .3 reported (roughly less than 5K of 17.5K) • Green – likely enough for processing .3<%<.999 • Yellow – may not be good for processing due to gap-filling - % > .999 • Red CO2 (second column) can be ignored for cropland/grassland sites • Sites shown are just a sample Of the 285 site years with good FC, 50 site years are missing one of (UST, PAR/Rg, and TA) and 79 sites have likely gap-filled data.
Units criteria Air (TA) and Soil (TS) temperatures are reported in degrees Celcius Radiation is measured in W/m2 (in) Relative humidity (RH) and soil water content (SWC) are reported in % (0:100) Air pressure (PRESS) is measured in kPA
Obviously bad annual averages Data cube used to browse average yearly Rg values across all site-years 16 additional likely problematic site-years at 5 sites
Drill down to consistent (bad) daily values Data cube used to browse 2005 Rg values shows consistently high reporting (not just a few very large spikes) at Duke Forest sites
Too many values out of range (TS) Database used to find sites with TA or TS outside the range of -30 °C to 50°C more than 200 times per year Data cube used to browse daily values of offending and nearby sites
Too many values out of range (Rg) Database used to find sites with Rg > 1100 W/m2 more than 200 times per year Data cube used to browse daily values in MJ/m2/d of offending and nearby site Locates site years with consistently bad as well as highly variable reporting
Incorrect minimum values Data cube used to browse annual minimum Rg values looking for site-years during which Rg does not return to zero at night
Incorrect units and/or sign FC at each site averaged over all reported years plotted by day of year
Drill down to Mead sites Daily average FC at each site shows likely units and/or sign issues
Drill down to other potential problems Four additional sites also have like reporting/units problems, but not across all reported years
CO2 Flux criteria CO2 flux (FC) measurements should not be “discrete” Differences between successive measurements should vary There should be a wide distribution in the deltas between successive values. Suggests lack of instrumentation precision, errors when converting units, or other data pre-processing error. Flux should not remain constant across many measurements Successive values should change. Suggests problems with instrumentation, bad gap-filling
Simple check: the same FC value reported too often • Database query returns count by (site, year, value) where count >= 500 • Graph shows sum of (returned counts) by site and year • Sites with high sums likely report very few unique FC values
Better check: the same difference between successive FC values reported too often • Database query returns count by (site, year, value) where count >= 500 • Graph shows sum of (returned counts) by site and year • Sites with high deltas likely discrete
Best check: count runs of constant values • Database query returns (site, year, run start time, run length) • Graph shows sum of (count(runs > 60 minuts)) by site and year • Sites with many runs VERY likely discrete (or poorly filled)
Drill down on Duke Forest-loblolly pine Many long runs that tend to start at dusk (17:30) and run through the night Count of runs with a specific value by length of run in minutes
Drill down on Shidler Long constant runs are not the problem The same values appear too frequently Count of runs with a specific value by length of run in minutes
Summary What we learned
Our observations • Data availability is the first requirement • Sensor, bias, units, and calculation issues can often be identified by comparison with other data • Running fast, simple queries that can rapidly find sites which clearly do not meet specific simple criteria seems viable • The specific queries we used can be generalized as stored procedures and applied to different measurement types • The data availability, units, and discrete data checks can be run in roughly one hour over the existing 285 site-years of data • These (and more?) checks could be run at data upload to the ORNL site • Catching data reporting errors and missing data early in the process is always best • Gives reporting scientists rapid feedback on potential for wider data usage • The results could be tabulated on the ORNL web site • This enables scientists without intimate knowledge of the data from various sites to know more about the data before downloading the actual data and repeating this sort of data quality check • All of this is essential to curating a usable scientific data set
Backup Technical Details and SQL queries
Spot sites with high TA/TS values select * from (select (select name from site where site.siteid = data.siteid) as sitename, (select shortname from datumtype where data.datumid = datumtype.datumid) as variablename, exdatumid, offsetid, datepart(yy,time) as yearOfMeasurement, count(*) as badcount from data where datumid in (select datumid from datumtype where shortname = 'TS' or shortname = 'TA') and data.value > 50. group by siteid, datumid, exdatumid, offsetid, datepart(yy,time) ) foo where badcount > 200 order by sitename, variablename, yearOfMeasurement, exdatumid, offsetid, badcount La Selva TS 1 1 1997 214 Sky Oaks-Old Stand TS 1 1 2000 549 Sky Oaks-Old Stand TS 1 1 2001 511 Sky Oaks-Old Stand TS 1 1 2002 720 Sky Oaks-Old Stand TS 1 46 2002 506 Sky Oaks-Old Stand TS 1 67 2002 274 Sky Oaks-Old Stand TS 1 46 2003 345 Sky Oaks-Old Stand TS 1 67 2003 412 Sky Oaks-Young Stand TS 1 26 2004 423 Sky Oaks-Young Stand TS 1 1 2006 881
Spot runs of constant values • Temporary table used for simplicity and speed (4.6M rows) • Table generation takes about 10 minute insert into fcboomCvI select siteid, datumid, value, time, exdatumid, offsetid from data as d where repeatid = 0 and d.sitesetid in (select sitesetid from siteset where description = 'L2 ORNL May 2007') and d.datumid = (select datumid from datumtype where shortname = 'FC') and d.exdatumid in (select exdatumid from exdatumtype where debris = '(none)' or debris = '_unadj') insert into fcboomCvI select siteid, datumid, value, time, exdatumid, offsetid from data as d where repeatid = 0 and d.sitesetid in (select Sitesetid from siteset where description = 'L2 ORNL May 2007') and d.datumid = (select datumid from datumtype where shortname = 'Other') and d.exdatumid in (select exdatumid from exdatumtype where debris like 'FC%'
Identify gaps and bin deltas • new30 column holds value of next 30 minute measurement (if any) • Takes about 2 minutes update fcboomCvI set new30 = (select value from fcboomCvI as two where one.siteid = two.siteid and one.datumid = two.datumid and one.exdatumid = two.exdatumid and one.offsetid = two.offsetid and two.time = dateadd(mi, 30, one.time)), new60 = (select value from fcboomCvI as three where one.siteid = three.siteid and one.datumid = three.datumid and one.exdatumid = three.exdatumid and one.offsetid = three.offsetid and three.time = dateadd(mi, 60, one.time)) from fcboomCvI as one • Difference between successive measurements binned to look for common values • Takes about 2 minues select (select name from site where foo.siteid = site.siteid) as sitename, datumid, delta30, SiteYear, exdatumid, offsetid, valuecount from (select siteid, datumid, (value - new30) as delta30, datepart(yy,time) as siteYear, exdatumid, offsetid, count(*) as valuecount from fcboomCvI where new30 is not null group by siteid, datumid, (value - new30), datepart(yy,time), exdatumid, offsetid) foo where valuecount > 499
Spot runs of constant values • Tag first measurement in a run of constant values with 1 and any additional measurements with 0 • Takes about 2 minutes update fcboomcvi set run30 = CASE WHEN one.value = (select value from fcboomCvI as two where one.siteid = two.siteid and one.datumid = two.datumid and one.exdatumid = two.exdatumid and one.offsetid = two.offsetid and two.time = dateadd(mi, -30, one.time)) THEN 0 ELSE 1 END from fcboomCvI as one where one.new30 is not NULL and one.new30 = one.value • Find all runs for export to spreadsheet • Takes about 10 minutes select (select name from site where mum.siteid = site.siteid) as sitename, datumid, value, time1, time2, datediff (mi, time1, time2) as runtime, exdatumid, offsetid, running30 from (select siteid, datumid, value, min(starttime) as time1, max(endtime) as time2, exdatumid, offsetid, running30 from (select one.siteid, one.datumid, one.value, one.time as starttime, one.time as endtime, one.exdatumid, one.offsetid, one.new30, one.run30, (select sum(two.run30) from fcboomcvi as two where one.siteid = two.siteid and one.datumid = two.datumid and one.exdatumid = two.exdatumid and one.offsetid = two.offsetid and two.run30 is not null and two.time <= one.time) as running30 from fcboomcvi as one where one.run30 is not null) foo group by running30, siteid, datumid, value, exdatumid, offsetid) mum where time2 <> time1