
Uploaded by
trina
1 SLIDES
163 VIEWS
10LIKES
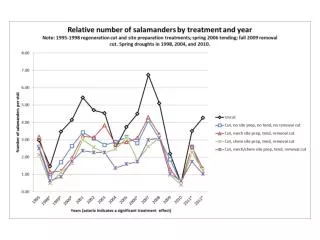
Analysis of Salamander Graph Data (1995-2012)
DESCRIPTION
This document presents an in-depth analysis of salamander population trends from 1995 to 2012. The graph illustrates significant changes in salamander numbers across various regions, highlighting factors such as environmental changes, habitat loss, and conservation efforts. The data show patterns of decline and recovery, providing critical insights into the species’ ecological status and the effectiveness of protective measures. This comprehensive overview aims to inform conservation strategies and promote further research into the health of salamander populations.
Download
1 / 1
Download Presentation 
Analysis of Salamander Graph Data (1995-2012)
An Image/Link below is provided (as is) to download presentation
Download Policy: Content on the Website is provided to you AS IS for your information and personal use and may not be sold / licensed / shared on other websites without getting consent from its author.
Content is provided to you AS IS for your information and personal use only.
Download presentation by click this link.
While downloading, if for some reason you are not able to download a presentation, the publisher may have deleted the file from their server.
During download, if you can't get a presentation, the file might be deleted by the publisher.
E N D
Presentation Transcript


More Related
Audio
Live Player